US Real Estate & Housing Market Reports
The housing market has experienced fluctuations in recent months, with varying sales and price trends across different regions in the United States. It can be confusing with conflicting data from year over year conflicting with monthly changes.
Taking a wider perspective on what’s happening in the real estate housing market lets us view with more clarity and objectivity. Contrast this housing data with likely outlooks on the economy and you can decide better when to buy a home or sell your home.
Let’s review the most recent real estate housing market reports from the three major housing market data sources: Realtor.com, Zillow, and Redfin.
1. Realtor.com’s Latest Report on the Housing Market
According to the National Association of REALTORS® (NAR) and Realtor.com, using data from its MLS system, existing-home sales saw a marginal increase in May.
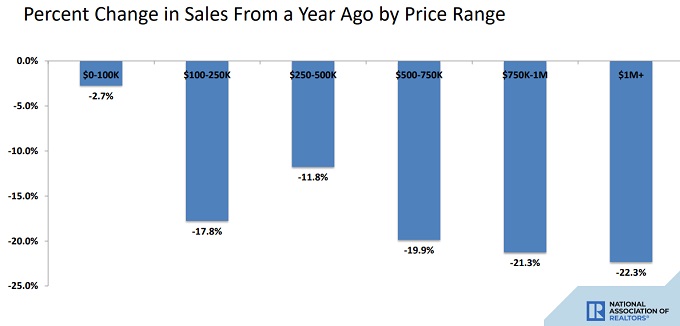
Total existing-home sales, including single-family homes, townhomes, condominiums, and co-ops, rose 0.2% from April to a seasonally adjusted annual rate of 4.30 million. However, compared to May 2022, sales dropped by 20.4% (down from 5.40 million).
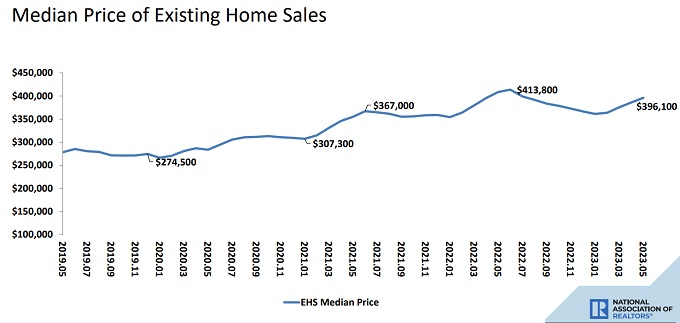
The median existing-home price for all housing types in May was $396,100, a drop of 3.1% from May 2022 ($408,600). The median existing single-family home price fell 3.4% to $401,100 in May vs 12 months ago. The median existing condo price stayed level at $353,000 in May, vs one year previous.
NAR’s forward-looking Pending Home Sales Index (PHSI)* showed home sales based on contract signings – fell by 2.7% to 76.5 in May and YoY pending transactions also fell by 22.2%.
The four major regions of the U.S. experienced mixed sales performance. The South and West regions posted improvements, while the Northeast and Midwest regions witnessed pullbacks. Despite the month-over-month increase, all four regions saw year-over-year sales declines.
The housing inventory at the end of May increased 3.8% from April yet decreased 6.1% from 12 months ago. Unsold inventory stood at a 3.0-month supply, up from 2.9 months in April and 2.6 months in May 2022. The current supply being roughly half the level of 2019 has contributed to the sizable decline in existing-home sales activity.
May 2023 U.S. Realtors home showings fell 3% year-over-year, to 759,401 showings, according to data from SentriLock.
Median Home Prices
In May, the median existing-home price for all housing types was $396,100, representing a decline of 3.1% from May 2022 when it stood at $408,600. While prices grew in the Northeast and Midwest regions, they fell in the South and West. This variation in median prices can be attributed to factors such as regional market dynamics, supply-demand imbalances, and local economic conditions.
Properties typically remained on the market for 18 days in May, down from 22 days in April but up from 16 days in May 2022. This decrease in the median days on market indicates a relatively faster pace of sales compared to the previous year. In fact, 74% of homes sold in May were on the market for less than a month, highlighting the strong demand and competitive nature of the current market.
First-Time Buyers and Cash Sales
First-time buyers accounted for 28% of sales in May, a slight decrease from the previous month but an increase compared to May 2022. The annual share of first-time buyers, according to NAR’s 2022 Profile of Home Buyers and Sellers, was 26%, the lowest recorded since the data began being tracked. This suggests a challenging environment for first-time buyers, possibly due to rising prices and limited inventory.
All-cash sales accounted for 25% of transactions in May, down from 28% in April and remaining consistent with the previous year. Individual investors or second-home buyers, who often contribute to cash sales, purchased 15% of homes in May, showing a decline from both April and the previous year. These statistics reflect the continued impact of investor activity on the housing market.
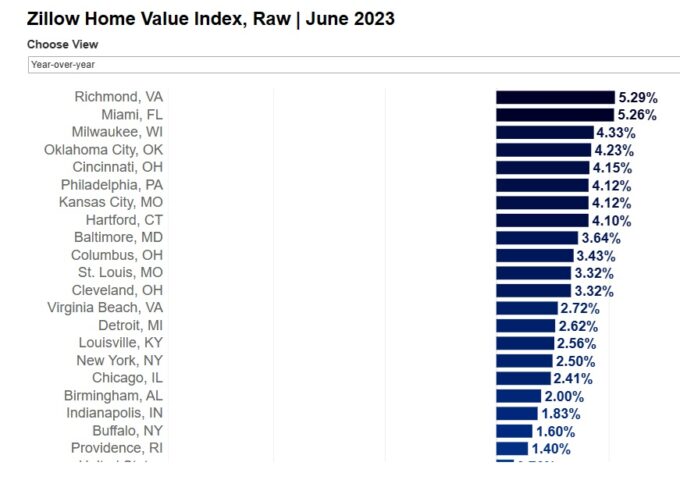
2. Zillow’s Perspective on the US Housing Market
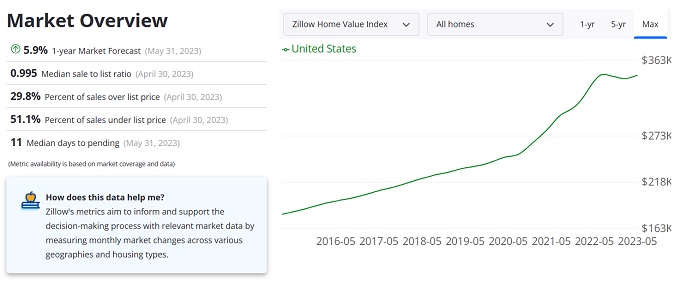
Zillow’s report emphasizes the impact of low inventory and affordability pressure on both buyers and sellers.
The spring home shopping season saw a slight increase in home sales from the previous month. However, the overall market still faces challenges. Limited inventory and volatile mortgage rates have affected buyer demand. Existing homeowners are reluctant to sell, holding onto their low mortgage rates and monthly payments, resulting in suppressed sales compared to the previous year.
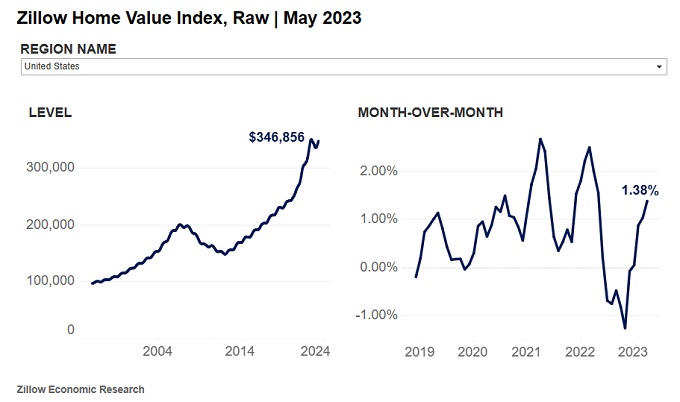
The bull market economic growth topped by the stimulus spend has sent home prices more than double in the last 10 years. And Zillow real estate report shows home price is back to brisk rises. See more on Zillow homes for sale and the Zillow hottest homes report.
Home Prices Fell
Home fell vs 12 months ago by the most in half of the 50 largest metro areas including Austin (-11.2%), San Francisco (-9.3%), San Jose (-8.4%), Phoenix (-7.0%), and Las Vegas (-6.9%).
The slow flow of new existing home listings coming onto the market has contributed to the decline in sales compared to a year ago.
Total active inventory in May fell 3.1% vs 2022, and is a staggering 45.7% below May 2019 home inventory levels.
Zillow’s market forecast prices for the next year is a rise of 5.9%.
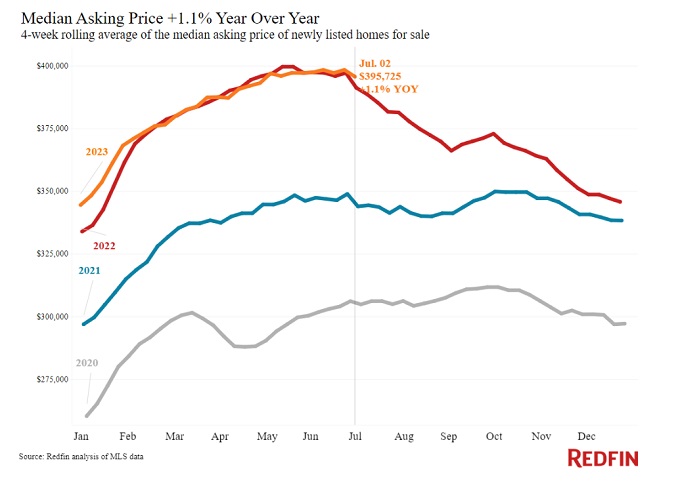
3. Redfin’s Report on the Residential Real Estate Market
Redfin’s report is the most up to date available. They report that,
- 32.3% of homes that went under contract had an accepted offer within the first two weeks on the market, down from 34% a year earlier.
- Homes that sold were on the market for a median of 27 days, the shortest span in 10 months, up from 20 days this time in 2022.
- 36.8% of homes sold above their final list price. That’s the highest share in 10 months but is down from 51% one year ago.
- 5.6% of homes for sale each week had a price drop, same as year (5.5%).
The newest Redfin report sheds light on the average sale-to-list price ratio, which surpassed 100% for the first time in nearly a year. This indicates that, on average, homes are selling above their asking prices. The lack of homes for sale is the main reason behind this trend, with new listings down 25% from a year ago and the total number of homes for sale down 12%. Homeowners are holding onto their relatively low mortgage rates, (locked in effect) contributing to the limited inventory.
Despite the double dilemma of low inventory and high prices, early-stage homebuyer demand is picking up. Redfin’s Homebuyer Demand Index, which measures requests for home tours and other buying services, increased 4% from a month earlier and is near its highest level in over a year. This signals a resilient demand for housing, even in the face of challenges.
What Do We Conclude about this National Housing Market?
In conclusion, the recent housing market data reflects the struggle between low housing stock, high interest rates, and a lack of effort to build new affordable housing.
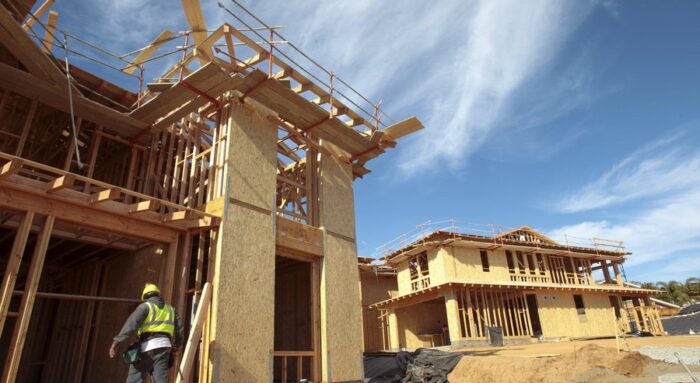
Existing-home sales have seen a marginal increase, but there are year-over-year declines across regions. Limited inventory continues to impact sales, leading to increased competition and higher prices, as homes sell above their asking price. The new construction market is picking up slightly, however it will take many years to pick up pace and within current housing regulations, will likely never meet the demand for homes, condos and apartments.
Change is needed in government at all levels. It is NIMBY interference, excessive costs, credit withdrawal, and a lack of support for builders and investors that are crippling the real estate market. In 2024, the failing commercial real estate market may send shock waves through the residential real estate market, threatening any progress made in 2023.
NAR’s President Kenny Parcell has one great idea: “A temporary capital gains tax reduction on a sale of investment property can lead to a boost in housing inventory, home sales and the economy… Policymakers need to seriously consider the measure.”
We need more of you chiming in with your representatives to put pressure on the government to solve the housing crisis. This is no time to push the country into recession.
These reports from Realtor.com, Zillow, and Redfin collectively give us a broader view of the complexities of the current housing market and how government regulation and high-interest rate policies are destroying the housing market, raising the cost of living, and generating crippling effects on American’s lives.
Real Estate May be the Very Best Investment Choice
The stock market vs housing market investment decision is another factor. If the stock market peaks and delivers weaker returns, money from equities could flow into real estate. It’s hard to beat real estate investment because land and buildings don’t just evaporate, they earn revenue, and they provide a tax haven.
Check to view: Los Angeles home prices, Bay area home prices, New York home prices, Boston home prices, San Diego home prices, Denver home prices, Dallas home prices, Austin home prices, and Miami home prices. See also the California report and Florida report.
Hottest Markets in the US Right Now:
Take note of the Dallas Fort Worth, Houston, Austin, Atlanta, Miami, Phoenix, Seattle, Tampa, Orlando, Denver, San Antonio, Las Vegas, and Nashville markets. Here are the cities with the highest listings with reduced price shares below courtesy of Realtor.com.
| Metro Area | Median Listing Price | Median Listing Price YoY | Active Listing Count YoY | Median Days on Market |
Price Reduced Share
|
| San Jose-Sunnyvale-Santa Clara, Calif. | $1,498,000 | 0.2% | -44.1% | 29 | 8.1% |
| Los Angeles-Long Beach-Anaheim, Calif. | $1,172,000 | 17.7% | -20.8% | 39 | 8.7% |
| San Francisco-Oakland-Berkeley, Calif. | $1,150,000 | 0.4% | -30.0% | 32 | 10.1% |
| San Diego-Chula Vista-Carlsbad, Calif. | $1,095,000 | 15.4% | -35.9% | 31 | 10.7% |
| Boston-Cambridge-Newton, Mass.-N.H. | $866,000 | 15.5% | -15.9% | 24 | 12.0% |
| Seattle-Tacoma-Bellevue, Wash. | $825,000 | 2.8% | -25.1% | 29 | 12.5% |
| New York-Newark-Jersey City, N.Y.-N.J.-Pa. | $749,000 | 11.0% | -14.3% | 51 | 8.2% |
| Denver-Aurora-Lakewood, Colo. | $680,000 | 0.0% | 6.1% | 29 | 20.3% |
| Sacramento-Roseville-Folsom, Calif. | $679,000 | 5.6% | -33.4% | 33 | 12.4% |
| Washington-Arlington-Alexandria, DC-Va.-Md.-W. Va. | $644,000 | 9.2% | -26.3% | 32 | 9.1% |
| Portland-Vancouver-Hillsboro, Ore.-Wash. | $640,000 | 6.7% | 8.1% | 34 | 16.1% |
| Miami-Fort Lauderdale-Pompano Beach, Fla. | $605,000 | -3.2% | 30.4% | 62 | 12.7% |
| Nashville-Davidson-Murfreesboro-Franklin, Tenn. | $591,000 | 5.2% | 63.3% | 34 | 20.8% |
| Riverside-San Bernardino-Ontario, Calif. | $580,000 | -3.2% | -18.1% | 44 | 11.9% |
| Austin-Round Rock-Georgetown, Texas | $580,000 | -6.8% | 47.8% | 45 | 33.0% |
| Providence-Warwick, R.I.-Mass. | $550,000 | 14.5% | -19.4% | 31 | 6.4% |
| Phoenix-Mesa-Chandler, Ariz. | $540,000 | -1.4% | -16.0% | 44 | 19.8% |
| Raleigh-Cary, N.C. | $479,000 | -4.2% | 19.8% | 43 | 12.3% |
| Dallas-Fort Worth-Arlington, Texas | $473,000 | -3.5% | 30.1% | 36 | 20.5% |
| Minneapolis-St. Paul-Bloomington, Minn.-Wis. | $460,000 | 8.9% | -4.7% | 31 | 11.2% |
| Orlando-Kissimmee-Sanford, Fla. | $459,000 | -1.2% | 21.4% | 46 | 14.9% |
| Kansas City, Mo.-Kan. | $453,000 | 13.6% | 11.1% | 50 | 12.0% |
| Tampa-St. Petersburg-Clearwater, Fla. | $445,000 | -1.0% | 30.5% | 46 | 18.8% |
Reasons Why People Are Still Eager to Buy Real Estate:
- home prices are appreciating and it’s a safe investment over the long term
- millennials need a home to raise their families
- rents are high giving property owners excellent ROI on rental properties owned
- flips of fixer uppers and older properties continue to create amazing returns
- real property is less risky (unless you get over-leveraged)
- the economy will improve by late 2024
- a home buying frenzy is ahead by 2025 as economy is unleashed (election hopes!)
Do the Underlying Economic Fundamentals Support Higher Home Prices?
Some think housing shortages and high interest rates will keep home prices high. This is a time when you can take changes to improve your life however, it’s wise to consider specifically where the real opportunities are. That might even include Real Estate Investing and investing in Rental Income Property.
Will 2024 Be Better?
- there will be more homes listed
- new construction will continue
- mortgage rates will remain elevated and credit hard to get
- competition for homes will ease off
- some sellers will find it easier to sell and move on with their lives as rates fall
- the economy will grow in Q4 2024 thus creating better markets overall including real estate
- home price growth will moderate a little (estimates of 5.3% growth by NAR, and 5.9% by Zillow)
- multifamily construction will level off after a productive period in 2022/2023
Check out the reports for cities such as Los Angeles, San Francisco, San Jose, Silicon Valley, New York, Miami, Tampa, Boca Raton, Salt Lake City, Sacramento, Oakland, Phoenix, Seattle, Denver etc. Buyers are still dreaming of California via the San Diego Real estate market, and the Los Angeles real estate market. See both potential sides of the 2024 with this post covering a possible, but unlikely US housing market crash. Looking to put your house up for sale in 2024? Find a Realtor now or discover how to sell home now at market value.
Share this post on Facebook, Twitter, or Linkedin. It’s good to share!!
Many Americans will soon be on their own without Fed assistance and facing back rent and overdue mortgages. Cities such as Denver, Dallas, Houston, San Antonio, Austin, Salt Lake City, Las Vegas, Tulsa, Seattle, Boston, New York, New Jersey, Chicago , San Antonio, Austin, Colorado Springs, Salt Lake City, an Los Angeles may see growth in listings.
California Housing Market | Florida Real Estate | Dream Homes | Florida Dream Homes | Boston Housing Market | Toronto Housing Market | Real Estate Market Forecast | Stock Trading Platforms | Stock Trading | Lines of Credit | Low Mortgage Rates | Travel Marketing Tips | Bleisure Travel Marketing | Travel Agency Software | SaaS Marketing Strategy | Travel Marketing | Business Travel Marketing | Travel