US Real Estate & Housing Market Predictions
Home Prices, Sales, Mortgage Rates and the Markets to Watch
The U.S. housing market is entering a very different phase of modest home price increases.
For several years, the overriding story was shortage: too few homes, extraordinarily low mortgage rates, intense competition and rapidly rising prices. In late 2026, housing is becoming much more complicated across cities from east to west. Sales have been depressed.
in 2026, there are more homes available for sale nationally. Sellers are cutting prices more frequently. Buyers have more negotiating power in many metropolitan markets. Yet housing remains extraordinarily expensive, and the 30-year mortgage rate was 7.28% as of October 1, according to Freddie Mac.
That combination is suppressing sales without causing a broad national decline in home values.
The result is best described as a slow-moving rebalancing of the housing market, with enormous differences between cities.

NAR Chief Economist Lawrence Yun, the NAR existing housing report for the month of August said “Mortgage rates and home sales move in opposite directions, so it’s not surprising to see a mild dip in home buying activity due to high mortgage rates. Still, home prices are rising, and existing home sales are actually up 1.6% year-to-date through the first eight months of the year. Homebuying demand, despite higher interest rates, is no doubt being supported by rising wages, which grew 3.1% in August, along with 643,000 net new jobs added since the start of the year. Job creation and wage growth typically drive housing demand.”

Inventory is still a factor. Nar reports 1.62 million units of total housing inventory are listed +3.2% from July and up 5.9% from August 2025. This was the first time since November 2019 that inventory exceeded 1.6 million units. And there is 4.9-month supply of unsold inventory, up from 4.6 months in July and 4.6 months in August 2025.
NAR: Single-Family Homes in August
The market saw 1.9% decrease in sales month-over-month to a seasonally adjusted annual rate of 3.62 million, which is down 1.1% from August 2025. The median house price rose 1.7% from 12 months ago to $434,800.
NAR: Condominiums and Co-ops in August
Condo sales dropped 2.7% decrease in sales month-over-month to a seasonally adjusted annual rate of 360,000 units, and the median price rose 1.5% annually to $371,600.
First-time buyers represented 30% of buyers, up slightly from 29% last month and from 28% one year ago.
The REALTORS® Confidence Index declined slightly in August, with 13% of respondents expecting an increase in buyer traffic in the next 3 months (down from 14% in July), while 17% expect an increase in seller traffic (down from 19% last year).
Housing markets in Chicago, New York and Boston remain relatively tight. San Francisco has strengthened considerably. Dallas, Denver, Miami and Los Angeles provide buyers with substantially more leverage. San Diego sits somewhere between those extremes. See more about those metro markets below.
For buyers, sellers, real estate agents, builders and investors, understanding those differences may be more important in 2027 than following the national average.
The US Housing Market Outlook for 2027
A base-case forecast, based on the latest Zillow, Fannie Mae, Mortgage Bankers Association, Federal Reserve, NAR and J.P. Morgan data, is for modest price appreciation and a gradual recovery in sales during 2027 rather than a major boom.
| U.S. housing indicator | Late 2026 / 2026 estimate | 2027 base case |
| Existing-home sales | 4.05–4.10 million | 4.20–4.30 million |
| Existing sales growth | Roughly flat | +3% to +6% |
| National home-price growth | 0% to +2% across major indexes | +1% to +3% |
| 30-year mortgage rate | Roughly 6.8%–7.3% | Roughly 6.7%–7.0% average |
| Total housing starts | About 1.3–1.35 million | About 1.3 million |
| Overall market | Low transactions, improving supply | Gradual sales recovery |
These figures should be interpreted as ranges rather than point estimates because the major housing indexes measure prices differently. Zillow’s ZHVI, Fannie Mae’s HPI and the S&P Cotality Case-Shiller index used by J.P. Morgan are not directly interchangeable.
Zillow now expects its measure of home values to rise 1.2% during 2026, while forecasting approximately 4.08 million existing-home sales using the NAR methodology. Fannie Mae’s September forecast puts 2026 existing sales at 4.062 million and 2027 at 4.215 million, while expecting its home-price index to rise 2.3% in 2026 and 1.0% in 2027.
J.P. Morgan is somewhat more cautious on 2026 prices but more constructive for next year, forecasting essentially flat Case-Shiller home prices in 2026 followed by approximately 3% growth in 2027.
Taken together, these forecasts point toward a 2027 market where affordability remains difficult but transactions begin recovering as buyers and sellers gradually adjust to permanently higher borrowing costs.
Mortgage Rates Remain the Gatekeeper
Almost every housing forecast ultimately comes back to mortgage rates. The average Freddie Mac 30-year fixed mortgage rate reached 7.28% on October 1, 2026, up sharply from 6.43% on July 2.
A $500,000 mortgage financed at 5% costs approximately $2,684 per month in principal and interest. At 7.25%, the payment is roughly $3,410 — more than $700 additional every month before property taxes, insurance and maintenance.
The Mortgage Bankers Association expects mortgage rates to average close to 6.8% over coming quarters, while Fannie Mae’s September forecast placed the 2027 annual average around 6.7%. Fannie’s forecast preceded the latest rate increase, however, making the MBA estimate particularly relevant now.
For housing, therefore, the important question may no longer be about mortgage rates dropping to 4%? Likely not, but possibly. With a hot US economy and low energy prices plus President Trump’s tax cuts, the stage might be set for inflation. So far however, inflation doesn’t look like an issue. Home prices and rental prices are not rocketing.
The big question for home buyers is whether incomes, home prices and buyer expectations can adjust sufficiently for a 6.5%–7% mortgage environment to become workable.
The US Economy Is Still Supporting Housing — But Only Partially
Housing normally becomes much more vulnerable when unemployment rises sharply, household income falls and distressed owners are forced to sell. Yet the US economy is fairly robust despite $100 a barrel oil and high FED rates.
Real U.S. GDP expanded at a 2.2% annualized rate during the second quarter of 2026. September payrolls increased by only 29,000, however, while unemployment stood at 4.2%, suggesting that the labor market has become considerably less vigorous.
The Federal Reserve’s September projections anticipate 2.3% real GDP growth in 2026 and 2.4% in 2027, with unemployment around 4.1% in both years. But Fed officials also project PCE inflation of 3.7% in 2026 before declining to 2.3% in 2027.
That leaves housing caught between two powerful forces.
Economic growth and relatively low unemployment help homeowners remain financially secure and limit forced selling. Inflation and higher long-term interest rates, however, prevent mortgage costs from falling far enough to generate a dramatic improvement in affordability.
Economic Factors Affecting the Housing Market
| Factor | 2026 | 2027 forecast | Likely housing effect |
| Real GDP growth | 2.3% | 2.4% | Supports household income and demand |
| PCE inflation | 3.7% | 2.3% | Lower inflation would help rates |
| Unemployment | 4.1% Fed projection | 4.1% | Limits forced selling |
| Fed funds rate, year-end | 4.1% | 4.1% | Monetary policy remains restrictive |
| 10-year Treasury yield* | 4.5% | 4.9% | Keeps mortgage costs elevated |
| 30-year mortgage rate* | 6.5% average | 6.7% average | Major affordability constraint |
| Fannie Mae HPI growth* | 2.3% | 1.0% | Much slower price appreciation |
*Fannie Mae forecast series; Federal Reserve projections are used for GDP, PCE, unemployment and the federal funds rate. Fannie’s September estimates predate the most recent rise in mortgage rates.
Housing Supply Is Finally Improving
The biggest change in the market is inventory. During the post-pandemic period, homeowners with 3% and 4% mortgages simply refused to sell. That “lock-in effect” removed enormous amounts of existing inventory from the market. That reluctance remains but is easing.
People relocate, retire, divorce, marry, have children, inherit homes or simply decide they cannot postpone their next move indefinitely.
Redfin reported that new listings increased 2.6% in August from July, reaching their highest level since 2022, while total homes for sale reached their highest level since 2020. Its August active-listing count was approximately 1.535 million, 2.7% higher than a year earlier.
Zillow’s numbers tell a similar story. Its August report showed approximately 1.41 million listings nationally, 3% above the previous year, and Zillow expects inventory to be about 10.1% higher year over year during the fourth quarter of 2026.
Construction Isn’t Yet Solving the Shortage
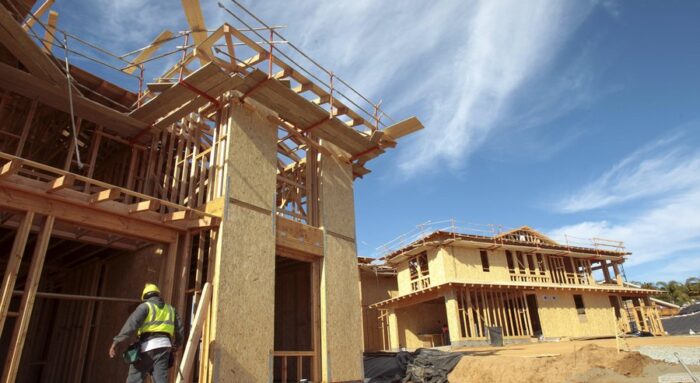
Builders suffer from interest-rate, materials and labor costs, and home buyer affordability problems.
August housing starts ran at a seasonally adjusted annual rate of approximately 1.275 million units, down 1.2% from the previous year. Single-family starts were stronger month to month at 918,000, but building permits were running at approximately 1.394 million.
Fannie Mae expects total housing starts around 1.35 million in 2026 and 1.33 million in 2027. Its forecast calls for approximately 897,000 single-family starts this year and 909,000 next year. Those aren’t big numbers.
J.P. Morgan argues that the United States has accumulated a structural housing shortage after years of underbuilding following the 2008 housing crash. High labor costs, land constraints, zoning restrictions, infrastructure requirements and construction economics continue to limit how quickly supply can respond.
That underlying shortage has helped keep national residential housing prices resilient even with mortgage rates above 7%.
What NAR’s Latest Housing Report Shows
The National Association of Realtors’ latest completed monthly existing-home-sales report is for August 2026. September’s report is scheduled for publication October 13th.
August existing-home sales declined 2.0% from July to a seasonally adjusted annual rate of 3.98 million, 1.2% below August 2025. Yet the median existing-home price still increased 1.6% year over year to $429,100.
Inventory rose to 1.62 million homes, representing 4.9 months of supply — a substantial improvement from the extremely tight conditions of recent years.
Pending sales provided little evidence of an immediate breakout. The NAR Pending Home Sales Index increased 0.3% in August from July but remained 4.7% below a year earlier.
This combination — weak transactions, gradually increasing supply and still-positive prices is the state of the market.
Redfin: More Sellers, But Where Are the Buyers?
Redfin’s analysis adds another dimension.
In August, Redfin estimated approximately 1.535 million sellers compared with only 972,300 buyers nationally. Sellers therefore outnumbered buyers by 57.9%, the largest imbalance in Redfin’s series.
That does not mean every city is experiencing falling prices, but only that the bargaining environment has changed. It’s not really an up and down market anymore. Sellers are committing to sales and they’re receiving stable prices.
Redfin reported that 59.5% of homes sold below their original list price in August. By late September, roughly 21% of active sellers had cut their asking price, a record share for that time of year. Yet Redfin’s late-September data showed the median sale price still approximately 2% above the previous year.
Zillow Sees Demand That Isn’t Converting Into Sales
One of Zillow’s most interesting new measures tracks engaged shoppers per listing.
Nationally, Zillow estimated 4.8 engaged shoppers for every listing during the second quarter, up 21.4% from a year earlier. People are browsing homes, saving listings and showing buying intent. Yet completed home sales during roughly the same spring period increased only 4.5%.
Mortgage payments, down payments, taxes and insurance are preventing buyers from acting on buying intent.
Zillow therefore expects only a modest national recovery. Its September forecast calls for roughly 3.766 million existing sales during 2026 using Zillow’s own methodology, or approximately 4.08 million under NAR’s sales methodology, while typical home values rise approximately 1.2%.
For the 2027 housing market there is substantial latent demand waiting for affordability to improve.
J.P. Morgan: Supply Is the Long-Term Constraint
J.P. Morgan’s housing outlook emphasizes something that short-term sales statistics can obscure.
America’s housing problem remains fundamentally pressured. Too much stimulus money combined with millions of immigrants has strained availability while construction can’t keep up. And with inflation high and insufficient investment in new housing, real estate becomes artificially overvalued.
J.P. Morgan predicts national home prices to be approximately flat during 2026 before rising around 3% in 2027. This suggests sustained price pressure upward due to limited housing supply, years of insufficient construction, restrictive zoning and high development costs.
Its analysis also recognizes that the mortgage lock-in effect continues to restrict listings, although that constraint should gradually diminish. In other words, today’s increase in homes available for sale should not be confused with a permanent national housing surplus.
Oddly, there may be too many sellers relative to today’s financially constrained buyers while America still has too few homes relative to its long-term population and household needs. It’s a mismatch of inventory vs the actual needs and financial capability of buyers.
Major Metro Housing Markets — Nine Different Stories
The regional divergence becomes obvious in Zillow and Redfin’s metro data.
Zillow’s August figures below use metro-area home values, transactions and inventory. Redfin’s market-balance measure compares estimated buyers with sellers. Redfin considers a market with more than 10% excess sellers a buyer’s market, within plus or minus 10% broadly balanced, and more than 10% excess buyers a seller’s market.
| Metro | Home value YoY | Sales YoY | Inventory YoY | Engaged shoppers/listing | Sellers vs buyers |
| Boston | +2.3% | +0.1% | -4.2% | 7.0 | +3.4% |
| San Diego | +1.0% | -6.3% | -2.0% | 6.8 | +36.1% |
| Chicago | +5.1% | +4.9% | -0.4% | 5.7 | +4.4% |
| Denver | -1.5% | -1.6% | 0.0% | 4.6 | +64.6% |
| Los Angeles | +1.4% | -2.0% | +0.5% | 6.1 | +63.2% |
| Miami | +0.5% | -1.0% | -2.6% | 2.4 | +138.3% |
| New York | +5.2% | -2.3% | -3.5% | 6.6 | +9.3% |
| San Francisco | +3.3% | +2.5% | -1.1% | 7.6 | -11.7% |
| Dallas | -1.9% | -2.1% | -1.3% | 4.0 | +107.6% |
A positive number in the final column means sellers exceed estimated buyers.
Boston: Limited Supply Keeps Prices Supported
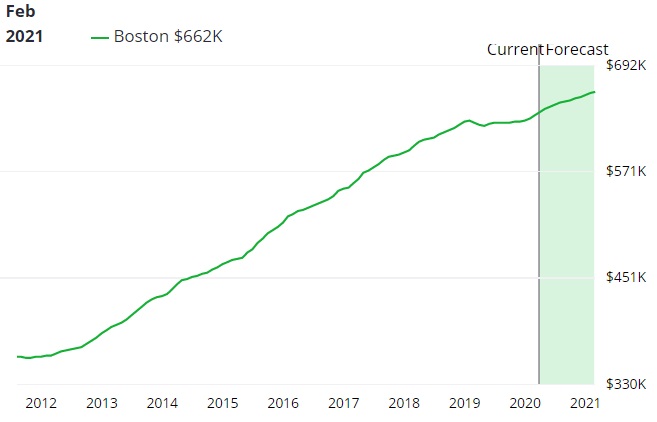
Boston is one of the more balanced major markets. Zillow reports home values up 2.3% year over year, sales essentially unchanged and inventory 4.2% below last year. The metro also attracts seven engaged shoppers per listing, considerably above the national average.
Redfin estimates only 3.4% more sellers than buyers, placing Boston firmly within its balanced-market range.
Boston therefore remains more supply-constrained than many Sun Belt metros. Unless employment deteriorates materially, limited inventory should continue supporting prices even while high mortgage rates restrain sales.
San Diego: Strong Interest, Difficult Affordability
San Diego illustrates how high demand can coexist with weak transactions. Zillow reports 6.8 engaged shoppers per listing, yet metro home sales were 6.3% below last year. Home values were still up approximately 1%.
Redfin estimates 36.1% more sellers than buyers, indicating meaningful buyer leverage at the metro level. The basic constraint is affordability. A typical Zillow metro home value near $935,000 combined with a 7% mortgage leaves many otherwise interested households unable or unwilling to buy.
San Diego could respond particularly strongly to any meaningful decline in mortgage rates because the underlying shopper interest remains considerable.
Chicago: One of the Stronger Large Markets
Chicago stands out as affordability yet constrained supply. Zillow’s metro home values increased 5.1% year over year, while sales rose 4.9%. Inventory was essentially unchanged.
Redfin finds only 4.4% more sellers than buyers, keeping Chicago in balanced territory.
Compared with coastal markets, Chicago also retains a significant affordability advantage. That combination of comparatively attainable prices, constrained supply and active transactions has allowed price growth to remain stronger than the national average.
Denver: Buyers Have Gained Considerable Power
Denver is undergoing a more substantial adjustment.
Zillow estimates metro home values are down 1.5% year over year, with sales down 1.6%. Redfin estimates approximately 64.6% more sellers than buyers.
Denver also recently had the highest price-cut share among major U.S. metros tracked by Redfin, at approximately 30.9%.
This is a very different environment from Denver’s pandemic-era housing boom. Buyers can take more time, compare properties and negotiate. Unless borrowing costs fall substantially, price growth is likely to remain restrained.
Los Angeles: Expensive Homes Meet Rate Resistance
Los Angeles home values remain remarkably resilient considering their cost.
Zillow places the typical metro value near $958,000, 1.4% above last year, while sales are down approximately 2%.
Redfin estimates 63.2% more sellers than buyers, demonstrating how much negotiating leverage has shifted.
Los Angeles therefore faces two competing forces: extremely difficult affordability is weakening transaction demand, while restricted housing availability helps support property values.
That combination may produce relatively flat prices rather than either rapid appreciation or a major correction.
Miami: America’s Most Buyer-Favored Major Market
Miami presents perhaps the sharpest contrast with less buyer interest and a flood of sellers.
Redfin estimates approximately 138% more sellers than buyers, the largest imbalance among the markets examined here.
Zillow shows home values only 0.5% above last year and transactions down 1%. Its engaged-shopper measure is just 2.4 shoppers per listing, half the national average. Redfin points to extensive new construction, higher property-insurance costs, HOA expenses and climate-related ownership costs as contributors to Florida’s changing market dynamics.
Miami’s luxury and international segments can behave differently, but the broad metro market has clearly shifted toward buyers.
New York: Supply Remains the Advantage
New York remains one of America’s more supply-constrained markets.
Zillow’s metro home values increased 5.2% year over year, while inventory declined 3.5%. The region attracts 6.6 engaged shoppers per listing.
Although sales declined 2.3%, Redfin finds only 9.3% more sellers than buyers — just inside its definition of a balanced market.
Parts of the broader metropolitan region are considerably tighter. Housing construction restrictions and access to one of the country’s largest employment centers continue creating strong competition for desirable suburban and commuter locations.
San Francisco Bay Area: AI Has Changed the Equation
San Francisco is one of 2026’s most interesting housing reversals. The AI investment boom is powering what would be an unattractive real estate market for buyers.
Zillow reports metro values up 3.3%, sales up 2.5% and an exceptional 7.6 engaged shoppers per listing.
Redfin estimates 11.7% more buyers than sellers, making San Francisco a seller’s market under its methodology. Redfin has linked part of the resurgence to hiring and wealth creation associated with the AI industry.
However, the Bay Area should not be treated as one homogeneous market. Redfin classified San Jose as approximately balanced, with 7.3% more sellers than buyers, while Oakland had approximately 28.6% more sellers and was therefore considerably more buyer-friendly.
AI-related wealth may increasingly differentiate neighborhoods and submarkets around the SF Bay area.
Dallas: Supply Gives Buyers Options
Dallas is almost the opposite of San Francisco and Silicon Valley.
Zillow reports metro home values down 1.9% year over year and sales down 2.1%. Redfin estimates an extraordinary 107.6% more sellers than buyers.
The broader Texas housing story is heavily influenced by construction. Sun Belt metros added far more housing during the previous expansion, giving buyers substantially more choice when demand slowed. Dallas still has long-term population and economic advantages, but in the immediate market buyers do not face the scarcity found in Boston, San Diego, New York or San Francisco. That should keep price increases restrained until demand catches up with available supply.
NAR’s Top Ten Cities with the Best Outlook
Deep Dive: The 10 NAR 2026 Housing Hot Spots
- Charleston, South Carolina: Driven by an influx of manufacturing, aerospace, and defense jobs, Charleston has maintained strong demand from out-of-state transferees. Its price growth is outperforming the national average, but a strong pipeline of single-family housing completions prevents rapid home price overheating, keeping entry-level neighborhoods accessible to buyers.
- Charlotte, North Carolina–South Carolina: As a massive banking and corporate hub, Charlotte attracts an exceptionally high share of millennials. Home values here have experienced consistent, steady upward growth. However, because local wage increases are keeping pace with real estate appreciation, Charlotte avoids the severe affordability traps seen in coastal cities.
- Columbus, Ohio: Columbus is one of the fastest-growing housing markets in the Midwest. Tech investments (such as Intel’s manufacturing expansion) have triggered a healthy baseline home price appreciation. Despite this steady growth, its median home price remains well below the national average, making it highly competitive for first-time buyers.
- Indianapolis, Indiana: Indianapolis stands out for its high concentration of “qualified buyer households” who are newly eligible to purchase as mortgage rates settle near 6%. Because home price appreciation has been moderate rather than explosive, it remains one of the most budget-attainable major metros on the list.
- Jacksonville, Florida: While South Florida deals with severe inventory gluts and cooling prices, North Florida’s Jacksonville has stayed resilient. It features a balanced mix of steady inventory expansion and strong job growth. Real estate pricing growth has leveled off into a sustainable, single-digit annual increase that rewards long-term equity builders.
- Minneapolis–St. Paul, Minnesota–Wisconsin: The Twin Cities region draws a steady stream of US domestic migration. This metro market boasts stable price growth. A strong uptick in recent residential construction has successfully matched local budgets, mitigating the hyper-competitive bidding wars seen elsewhere.
- Raleigh, North Carolina: Fueled by the Research Triangle’s unstoppable economic engine, Raleigh features a massive millennial buying cohort (averaging near 40% of the local demographic). While values have climbed significantly over the last few years, a continuous rollout of new building permits is easing supply pressures, helping price growth stabilize into an accessible trajectory.
- Richmond, Virginia: Richmond is a top destination for remote workers and families migrating out of the high-cost Northeast corridor. This sustained demand has driven healthy home equity growth. It earned its spot on the NAR list because its absolute entry price point offers vastly superior square footage value compared to nearby Washington, D.C., or New York.
- Salt Lake City, Utah: Salt Lake City boasts a booming tech sector and leads the country in Gen Z homeownership trends. Following a period of aggressive post-pandemic price corrections, its real estate values have leveled out. The current market presents an excellent window for buyers to purchase into a highly durable economy with great long-term appreciation prospects.
- Spokane, Washington: Serving as the Inland Northwest’s primary relief valve, Spokane captures buyers priced out of Seattle, Western Washington, and California. While it has experienced significant price acceleration over the last five years, its 2026 growth trajectory has normalized into a healthier, sustainable rhythm supported by localized income gains
The 2027 Housing Market May Reward Patience
The national housing market isn’t collapsing and a housing market crash is not expected, nor likely. There are more listings. More sellers are cutting prices. Homes are taking longer to sell in many cities. Buyers have regained negotiating power and they’re praying for lower mortgage rates.
At the same time, unemployment remains relatively low, distressed selling is limited, construction remains insufficient to erase the long-run housing shortage, and millions of homeowners still have little financial incentive to surrender older low-rate mortgages. Those forces help explain why national prices continue edging upward despite historically difficult affordability.
A good base case for 2027 is therefore a gradual improvement in transaction volume with modest national price appreciation of roughly 1% to 3%.
A sustained mortgage-rate decline below roughly 6.5% would change the picture considerably. The large population of financially constrained but actively engaged home shoppers could return to the market quickly, increasing both sales and price pressure. Conversely, mortgage rates remaining well above 7% would probably prolong today’s low-transaction environment and put greater downward pressure on buyer-friendly markets such as Dallas, Denver and Miami.
The most important housing story of 2027 may therefore not be whether the U.S. housing market rises or falls. It’ll be about which local markets have enough demand, insufficient supply and sufficient household purchasing power to outperform while the national market slowly works its way through an affordability reset.
The stock market is the main source of American wealth now, and undoubtedly will affect the housing market going forward. See more on the US stock market forecast and how you might grow your equity wealth to afford to buy a home.
Call Gord about Realtor marketing Services.