Best Cities to Buy Real Estate in 2024
We’re nearing 2025 with a new incoming, pro-business, deregulating, lower-tax President and it’s going to have millions of Americans thinking about a move — either across town or to another metro area where life is more affordable and enjoyable.
While jobs and personal economics rule, buyers are avoiding some situations in favor of places that offer a better standard of living. Polls show most Americans feel they’re worse off than they were 4 years ago, and some states and cities have dark clouds hanging over them as big changes happen in the US government. The incoming Republicans may be a bigger factor than lower mortgage rates. A shrinkage of government and a reduction in government spending is sure to make some cities a buyer’s market while others will be fueled by the new pro-American theme.
Before you get too focused on cities such as Austin, and others in Texas, for many of you, these cities below remind you of those that are affordable, livable, and able to thrive in the next 5 years.
Overall, the changes expected should create a very hot housing market in the next 5 years.
The Right Cities to Buy Real Estate in 2024?
Best and right really depend on the needs of each family and person. From digital remote nomads looking for lower costs to Millennials advancing their careers, income and hoping to start a family, to seniors looking to finally sell their home and seek out their retirement nest somewhere, movers are driven by different needs.
John Burn’s Research found the overall trend is a move to the South, where the warmth, sunshine, lower taxes and lower home prices are alluring. Migration out of blue states has picked up and will likely increase in 2025.

Major Cities with Excellent Potential
These major cities are looking strong for the years ahead, especially those with low tax burdens which are pro-business.
Businesses are willing to relocate to these cities and states and with growing workforces, profitable business, and commitments to infrastructure, they might be your best bets as an investment. Americans will follow businesses as they have with the California exodus to Texas.
US News released its review of the best cities to live in America. Given quality of life is a big factor for many buyers, their rankings are worth a view. It’s a list of predominantly southern, high-growth cities with lower real estate prices, with Naples Florida being the exception. Florida’s rise as a business-friendly, investment-friendly state is attracting the attention of high-net-worth individuals from California and the Northeast.
The number of Carolina cities reflects a strong trend in buyers for lower home prices, established culture and communities, room to grow, mountain-to-sea recreation, moderate weather, safe communities and strong growing economies. The laid back culture of North Carolina and South Carolina are appreciated and it’s drawing a sizable number of Americans.
Their top picks for value and livability are:
- Naples, Florida — a great place to live and retire for wealthy buyers who thrive on no income tax and zero inheritance tax policies.
- Boise, Idaho — booming city for development and unparalleled nature and recreation, but no so affordable.
- Colorado Springs, Colorado — booming city with growing neighborhoods, spectacular scenery and rustic history. See the latest housing market update for Colorado Springs.
- Greenville, North Carolina — big businesses have moved to the city near the blueridge mountains giving newcomers affordable homes and an amazing lifestyle.
- Charlotte, North Carolina — the largest city in the region creates a diversity of career and job opportunities from financial services to manufacturing, while giving access to amazing recreational opportunities.
- Raleigh, North Carolina — Raleigh, Durham and Chapel Hill, a right sized, growing tri-city area is known for colleges, tech and friendliness.
- Huntsville, Alabama — Low home prices and rent prices are drawing plenty of newcomers to a more laid back lifestyle, appealing to new familiesa and retirees.
- Austin, Texas — For tech workers and entrepreneurs, Austin represents the new American Silicon Valley, particularly with Elon Musk’s many companies placed here in the dawn of the AI revolution. The best Texas city comes with higher home prices too, but newcomers appreciate the new cultural vibrancy here if not house prices and rent prices.
- Boulder, Colorado — a spectacular small city situated in the Colorado Rockies, Boulder has its own cultural vibrancy, tourism industry, and one of the highest rated cities for recreation. The young population however has to contend with housing shortages, high home prices and high rent prices.
- Virginia Beach, Virginia — a resort styled city supported by big government has made it highly desirable to public sector workers, and with medium home prices, the high income earners here have an affordable lifestyle.
- Sarasota, Florida — Perhaps the most beautiful city on the Gulf Coast, Sarasota offers an abundance of amazing condos and homes, where residents tend to be very wealthy and retired. Access to beautiful long beaches, amazing weather, and a pleasant, walkable downtown area make the low home prices here even more tantalizing for movers.
- Green Bay, Wisconsin — offering the perfect mix of big-city amenities in a Midwestern, small-town style culture with colleges makes it an interesting possibility for young families.
- Charleston, South Carolina — a quaint, southern style city known for its culture amenities is an attractive option for retirees and those who love a laid back lifestyle that includes trips to the beach, good food and entertainment.
- Madison, Wisconsin — a small-sized city welcoming health care, information technology and manufacturing businesses featuring low house prices and rents, and a new trendy vibe.
- Lexington, Kentucky — one more right sized city that features a variety of industries, a temperate climate and plenty of access to the great outdoors, which newcomers appreciate along with their low house prices and rent prices.
- Oklahoma City, Oklahoma — a city on the great plain, it offers stable, western styled culture and wide open spaces along with very low home prices and rents.
- Ashville, South Carolina — high above in the smoky mountains of South Carolina is a city more people are talking about. It’s home to the Biltmore Estate and has a laid back beer culture that many Americans find charming. Homes are a little pricey compared to the average family income, but rent prices are very reasonable.
Real Estate Markets under 100,000 Population
Smaller have a unique capacity for good living, while still offering most of the amenities of large cities (Population Under 100,000)
- Bend, Oregon: Known for its outdoor recreation opportunities and a growing tech sector. It’s a popular spot for both retirees and young professionals.
- Carmel, Indiana: Offers a high quality of life with excellent schools and a strong local economy. It’s close to Indianapolis, providing access to larger city amenities.
- Ann Arbor, Michigan: Home to the University of Michigan, which drives the local economy and creates a steady rental market.
- Asheville, North Carolina: Attracts tourists and new residents alike with its vibrant arts scene and beautiful mountain setting.
- Sarasota, Florida: Known for its cultural amenities, beaches, and appeal to retirees, it has a strong real estate market.
Santa Fe, New Mexico: Offers a unique cultural experience with a thriving arts scene, appealing to a diverse group of buyers. - Rochester, Minnesota: Home to the Mayo Clinic, which provides a stable job market and attracts residents from all over the world.
- Charlottesville, Virginia: A historic city with a strong educational foundation due to the University of Virginia and a growing tech sector.
- Boulder, Colorado: Known for its outdoor lifestyle, tech industry, and educational institutions, it’s a sought-after location for various demographics.
- Fargo, North Dakota: Has a growing economy, especially in the healthcare and tech sectors, and offers a high quality of life with a small-town feel.
- Hilton Head Island, South Carolina: Popular for its beaches and golf courses, it’s a prime location for vacation homes and retirement living.
- College Station, Texas: Driven by Texas A&M University, it has a strong rental market and is seeing steady growth.
Ithaca, New York: Home to Cornell University and Ithaca College, creating a strong rental market and a vibrant community. - Plymouth, Minnesota: Offers a high quality of life with good schools and a strong job market, being close to Minneapolis.
- Prescott, Arizona: Known for its historic charm and appeal to retirees, offering a mild climate and a variety of outdoor activities.
Buying Property in Small Towns of Less Than 30,000 Population
Small towns and villages are very popular but with limited housing available. Today, small towns sitll offer shopping, amenities, schools and social opportunities that give them an edge in the real estate market. Homes in these communities are highly cherished by young families looking for a great environment to raise their kids and for more rewarding social connections for healthy, happy living.
Try this array of charming towns with a history for compelling living and more affordability.
- Leavenworth, Washington: Known for its Bavarian-style architecture and vibrant festivals. It’s a great place for those who love outdoor activities and a strong sense of community.
- Taos, New Mexico: Famous for its artistic community, Pueblo architecture, and beautiful desert landscape. Ideal for those seeking cultural richness and inspiration.
- Stowe, Vermont: A picturesque ski town offering year-round outdoor activities and a quaint, New England charm.
- Carmel-by-the-Sea, California: Known for its stunning coastline, artistic community, and fairy-tale cottages. It’s a peaceful retreat for those looking for a blend of art and nature.
- Beaufort, South Carolina: Offers a historic downtown, beautiful antebellum architecture, and a coastal lifestyle.
- Eureka Springs, Arkansas: A Victorian town in the Ozark Mountains, known for its arts, culture, and natural springs.
- Lititz, Pennsylvania: Has a rich history, unique shops, and a small-town feel, making it ideal for families and history enthusiasts.
- Hood River, Oregon: A haven for outdoor enthusiasts, with strong windsurfing and kiteboarding scenes, set amidst beautiful scenery.
- Telluride, Colorado: Renowned for its ski slopes and film festivals, it’s perfect for those seeking an active lifestyle and mountain beauty.
- Franklin, Tennessee: Offers a blend of Southern charm and history, with a vibrant music scene and a strong sense of community.
- Mackinac Island, Michigan: Known for its car-free streets and historic charm, it’s like stepping back in time.
- Breckenridge, Colorado: A historic mining town with world-class skiing and a lively downtown area.
- Decorah, Iowa: Offers a strong Norwegian heritage, beautiful parks, and a famous Nordic Fest.
- Port Townsend, Washington: A maritime town with Victorian architecture and a vibrant arts scene.
- Bisbee, Arizona: A former mining town turned artist haven, known for its colorful houses and unique history.
- Woodstock, Vermont: Epitomizes New England charm with its historic homes and covered bridges.
- Dahlonega, Georgia: Rich in gold mining history and nestled in the North Georgia mountains, offering a quaint downtown and scenic beauty.
- Galena, Illinois: Known for its well-preserved 19th-century buildings and main street, ideal for history buffs.
- Jim Thorpe, Pennsylvania: Often called the “Switzerland of America” for its picturesque setting and rich history.
- Crested Butte, Colorado: A mountain town with stunning landscapes, known for wildflower displays, skiing, and mountain biking.

And if the economy does recover in 2024, Texas and Florida will likely see return of brisk buying and inmigration.
American Migration Trends: Top Cities
Top cities where Americans are Moving to or From

Which Cities/Towns Have the Qualities You Seek?
The matter of price vs rental yields, employment growth, taxes, vacancy rates are key signals that will color estimates of value in cities and states both. For homebuyers who want to reside in a particular city, of course prices, taxes, crime rates, school quality, good neighborhoods, and strong employment levels as most important.
17 Things Features To Evaluate in the Best City to Buy Income Real Estate:
- lowest vacancy rate
- rising working-age population
- rising developments
- lowest price-to-rent ratios
- rising number of millennials or baby boomer retirees
- growing economy
- good metro GDP
- lots of US-based companies
- local restrictions on new construction
- located in the heartland or south region
- lower purchase prices
- lower property taxes
- lowest state income taxes
- better ratings for schools
- lifestyle rating
- lower crime rating
- lower pollution and quick commutes
Which cities and states offer the best employment outlook, lowest taxes, fewest regulations, large millennial population, and a pro-business climate? Texas might be first in line, especially as the price of oil has climbed back up to $35 a barrel.
Which State is Most Attractive?
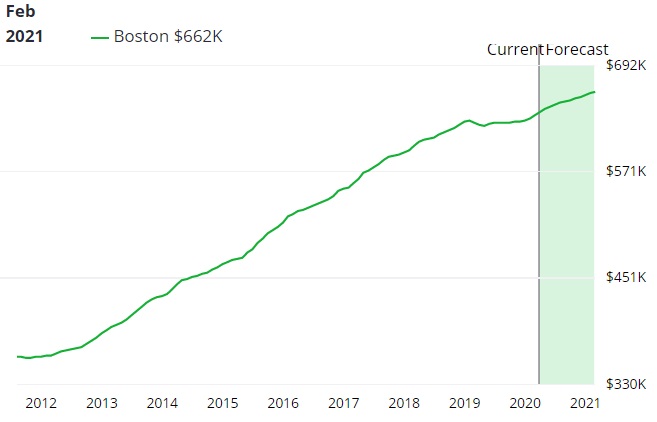
The climate, cost of doing business, state business incentives, presence of labor, and tax costs in each state comes into the calculation. Georgia, Texas, and Michigan would definitely rise to the front of the line. However, cities in North Carolina, Idaho, Texas, Florida, Illinois, Pennsylvania, Colorado, Miami Florida, Boston, Massachusetts, and Ohio also offer potential savings for New York and California companies who are looking to relocate.
Milken Institute’s look at the Best Cities
Milken Institute conducts an investigation of the best big and small towns to consider. This year’s ranking takes these factors into consideration:
- Job growth
- Wage growth
- Short-term job growth
- High-tech GDP growth
- High-tech GDP concentration
- Number of high-tech industries
Yet Milken didn’t appear to take into account the non-employment factors in relocation — namely remote work. Even as subways, airlines, trains, buses gear up for the long daily commutes, we may turning more to a more commute-free trend where pollution and time waste must be reduced.
At the same time, many corporations are pushing employees hard to return to headquarters to work in person. This has affected migration in the country. The best cities are situated in states with lower population density offering lower taxes and either lifestyle or employment/career advantages.
Here’s Milken Institute’s 2023 selection of best cities:
- Provo-Orem, Utah
- Austin-Round Rock, Texas
- Raleigh, NC
- Nashville-Davidson-Murphreesburg-Franklin, TN
- Boise City, ID
- Dallas-Plano-Irving, TX
- Wilmington, NC
- Phoenix-Mesa-Scottsdale, AZ
- Fayetteville-Springdale-Rogers, AR
- Palm Bay-Melbourne-Titusville, Florida
And Milken chooses their top 10 Small Cities:
- Idaho Falls, Idaho
- Logan, Utah-Idaho
- St. George, Utah
- The Villages, Florida
- Bend-Redmond, Washington
- Punta Gorda, Florida
- Coeur d’Alene, Idaho
- Missoula, Montana
- Sioux Falls, South Dakota
- Gainesville, Georgia
- Prescott, AZ
- Bloomington, Indiana
- Wenatchee, Washington
- Burlington, North Carolina
- Twin Falls, Idaho
Cities that Are Rated as Declining:
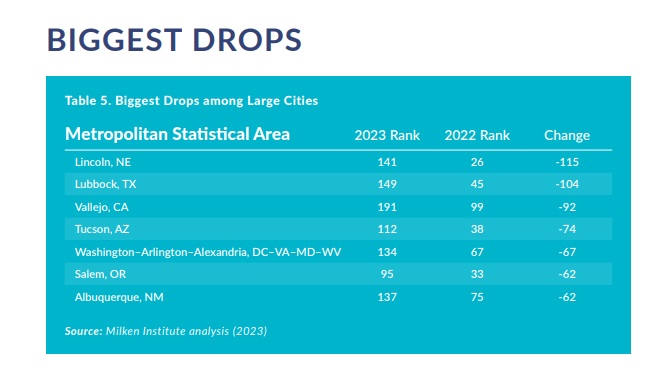
Source: Milken Institute (2023 report)
Wallethub: Best Places to Buy a House
Wallethub the mortgage rate website offers an extensive look at America’s best cities in 2023 from many perspectives. Their calculations focus mainly on quality of life which is after, very important.
However, there is little pertaining to buying homes and rental property nor which will be the best cities in 2024. A few more columns for taxes, income, economic growth, and price-to-rent ratios would be nice.
Best Small Cities to Live in America
| City | Total Score | Affordability | Economic Health | Education & Health | Quality of Life | Safety | |
|---|---|---|---|---|---|---|---|
| Lancaster, PA | 71.04 | 800 | 215 | 659 | 10 | 59 | |
| Carmel, IN | 70.91 | 30 | 36 | 197 | 273 | 27 | |
| Fair Lawn, NJ | 70.59 | 136 | 130 | 29 | 888 | 29 | |
| Lexington, MA | 70.58 | 405 | 68 | 4 | 208 | 7 | |
| Brentwood, TN | 70.57 | 34 | 74 | 169 | 340 | 97 | |
| Melrose, MA | 70.42 | 413 | 78 | 10 | 715 | 22 | |
| Zionsville, IN | 69.9 | 3 | 145 | 177 | 836 | 103 | |
| Needham, MA | 69.88 | 161 | 165 | 20 | 537 | 26 | |
| Portland, ME | 69.82 | 1056 | 454 | 58 | 13 | 380 | |
| Westfield, IN | 69.8 | 41 | 128 | 236 | 822 | 37 | |
| Milton, MA | 69.72 | 140 | 427 | 27 | 674 | 12 | |
| Sammamish, WA | 69.7 | 183 | 89 | 75 | 1164 | 30 | |
| Dublin, OH | 69.31 | 10 | 92 | 719 | 189 | 131 | |
| Brookfield, WI | 69.23 | 91 | 224 | 70 | 294 | 270 | |
| Leawood, KS | 69.06 | 6 | 81 | 105 | 851 | 194 | |
| Apex, NC | 68.93 | 38 | 20 | 206 | 586 | 164 | |
| Arlington, MA | 68.92 | 750 | 352 | 8 | 222 | 8 | |
| Burlington, MA | 68.85 | 367 | 27 | 11 | 488 | 85 | |
| Newton, MA | 68.83 | 680 | 150 | 7 | 338 | 14 | |
| Princeton, NJ | 68.71 | 596 | 114 | 255 | 84 | 60 | |
| Redmond, WA | 68.71 | 604 | 9 | 81 | 113 | 374 | |
| Randolph, MA | 68.58 | 696 | 456 | 53 | 1156 | 275 | |
| Ridgewood, NJ | 68.56 | 262 | 66 | 24 | 947 | 15 | |
| Leesburg, VA | 68.53 | 211 | 334 | 39 | 185 | 181 | |
| Saratoga Springs, NY | 68.46 | 751 | 119 | 101 | 51 | 376 | |
| Fishers, IN | 68.42 | 25 | 305 | 198 | 618 | 35 | |
| Castle Rock, CO | 68.38 | 103 | 167 | 48 | 451 | 185 | |
| Wake Forest, NC | 68.36 | 68 | 13 | 260 | 501 | 286 | |
| Medford, MA | 68.35 | 888 | 23 | 16 | 437 | 80 | |
| Reading, MA | 68.33 | 171 | 654 | 6 | 1088 | 9 |
Best Cities for Rental Income Property
For rental property investment buyers, the rules that govern the best places to buy are similar as with young home buyers — employment stability, jobs outlook, migration trends, state GDP, city economic outlook, and house prices. For landlords, cap rates, price-to-rent ratios, rent price trends, and projected maintenance costs come into the picture.

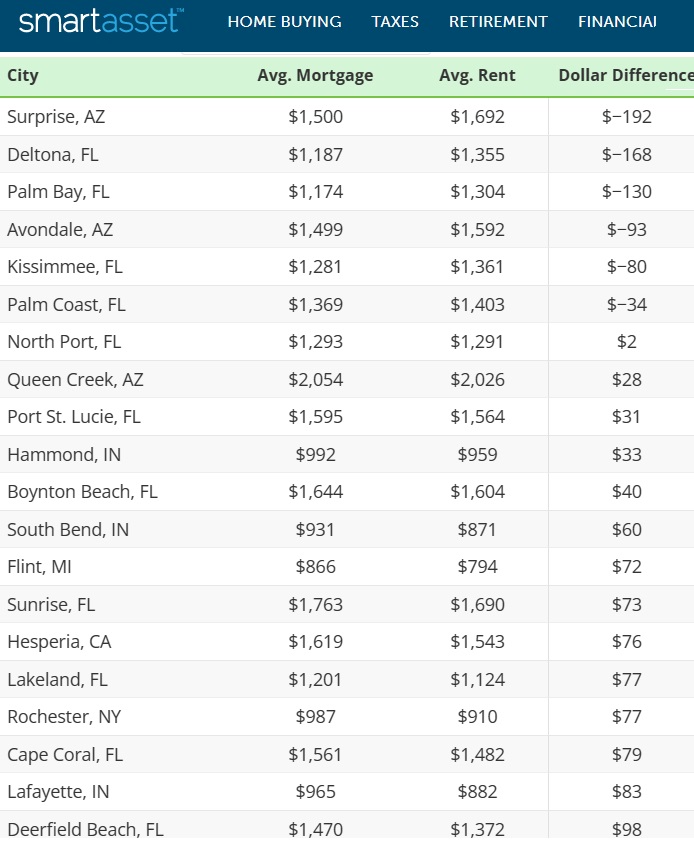
Cities where it’s Better to Buy than Rent
This buy/rent difference stat is important for those want to wait to rent, and for investors who might want to avoid cities where it’s cheaper to buy.
Top 80 Cities and their Potential for Passive Rental Income ROI
These converted stats in this chart from Smart Assets are very insightful. They used U.S. Census data, to calculate the price-to-rent ratio in every U.S. city with a population over 250,000.
This is their list of 80 US cities below with the worst potential for rental property income investment appearing at the top (The ones at bottom such as Detroit have better potential, unless employment fails to recover in Michigan).
| US Cities with Population above 250k | Price-to-Rent Ratio |
Home Price (for a $1,000 Rental) |
|
| 1 | San Francisco, California | 45.9 | 551000 |
| 2 | Honolulu, Hawaii | 40.1 | 481000 |
| 3 | Oakland, California | 38.5 | 462000 |
| 4 | Los Angeles, California | 38.0 | 456000 |
| 5 | New York, New York | 35.7 | 428000 |
| 6 | Seattle, Washington | 35.1 | 421000 |
| 7 | San Jose, California | 34.7 | 417000 |
| 8 | Long Beach, California | 34.6 | 415000 |
| 9 | Washington, District of Columbia | 32.0 | 384000 |
| 10 | Anaheim, California | 31.3 | 375000 |
| 11 | San Diego, California | 30.3 | 363000 |
| 12 | Portland, Oregon | 29.3 | 351000 |
| 13 | Boston, Massachusetts | 28.7 | 344000 |
| 14 | Jersey City, New Jersey | 26.3 | 316000 |
| 15 | Denver, Colorado | 26.0 | 312000 |
| 16 | Chula Vista, California | 25.8 | 310000 |
| 17 | Santa Ana, California | 25.3 | 303000 |
| 18 | Sacramento, California | 24.3 | 291000 |
| 19 | Miami, Florida | 23.4 | 280000 |
| 20 | Austin, Texas | 23.4 | 280000 |
| 21 | Atlanta, Georgia | 23.0 | 276000 |
| 22 | Colorado Springs, Colorado | 22.8 | 274000 |
| 23 | Bakersfield, California | 22.5 | 270000 |
| 24 | Raleigh, North Carolina | 22.4 | 269000 |
| 25 | Riverside, California | 22.4 | 268000 |
| 26 | Lexington, Kentucky | 22.0 | 264000 |
| 27 | Albuquerque, New Mexico | 21.9 | 263000 |
| 28 | Chicago, Illinois | 21.6 | 259000 |
| 29 | Henderson, Nevada | 21.6 | 259000 |
| 30 | Chandler, Arizona | 21.5 | 257000 |
| 31 | New Orleans, Louisiana | 21.4 | 256000 |
| 32 | Virginia Beach, Virginia | 21.1 | 253000 |
| 33 | Fresno, California | 21.0 | 252000 |
| 34 | Newark, New Jersey | 21.0 | 251000 |
| 35 | Minneapolis, Minnesota | 21.0 | 252000 |
| 36 | Anchorage, Alaska | 20.9 | 251000 |
| 37 | Phoenix, Arizona | 20.3 | 244000 |
| 38 | Louisville, Kentucky | 20.1 | 241000 |
| 39 | St. Paul, Minnesota | 20.0 | 239000 |
| 40 | Plano, Texas | 19.9 | 239000 |
| 41 | Stockton, California | 19.5 | 234000 |
| 42 | Durham, North Carolina | 19.5 | 233000 |
| 43 | Las Vegas, Nevada | 19.3 | 232000 |
| 44 | Nashville, Tennessee | 19.1 | 230000 |
| 45 | Greensboro, North Carolina | 19.1 | 229000 |
| 46 | Mesa, Arizona | 19.1 | 229000 |
| 47 | Lincoln, Nebraska | 19.1 | 229000 |
| 48 | Oklahoma City, Oklahoma | 19.1 | 229000 |
| 49 | Wichita, Kansas | 18.4 | 221000 |
| 50 | Charlotte, North Carolina | 18.1 | 217000 |
| 51 | Cincinnati, Ohio | 18.0 | 216000 |
| 52 | Aurora, Colorado | 18.0 | 216000 |
| 53 | Kansas City, Missouri | 17.4 | 209000 |
| 54 | Tulsa, Oklahoma | 17.2 | 206000 |
| 55 | Omaha, Nebraska | 16.7 | 200000 |
| 56 | St. Louis, Missouri | 16.7 | 200000 |
| 57 | Orlando, Florida | 16.6 | 199000 |
| 58 | Tampa, Florida | 16.6 | 199000 |
| 59 | Tucson, Arizona | 16.3 | 196000 |
| 60 | Philadelphia, Pennsylvania | 16.3 | 196000 |
| 61 | Dallas, Texas | 16.2 | 194000 |
| 62 | Laredo, Texas | 15.9 | 191000 |
| 63 | Columbus, Ohio | 15.9 | 190000 |
| 64 | St. Petersburg, Florida | 15.8 | 189000 |
| 65 | Fort Wayne, Indiana | 15.5 | 186000 |
| 66 | Baltimore, Maryland | 15.5 | 186000 |
| 67 | Arlington, Texas | 15.5 | 186000 |
| 68 | El Paso, Texas | 15.4 | 185000 |
| 69 | Indianapolis, Indiana | 15.4 | 184000 |
| 70 | Houston, Texas | 15.3 | 183000 |
| 71 | Fort Worth, Texas | 14.8 | 177000 |
| 72 | Jacksonville, Florida | 14.3 | 172000 |
| 73 | Milwaukee, Wisconsin | 14.2 | 170000 |
| 74 | San Antonio, Texas | 13.7 | 164000 |
| 75 | Toledo, Ohio | 13.3 | 159000 |
| 76 | Corpus Christi, Texas | 13.1 | 158000 |
| 77 | Memphis, Tennessee | 12.3 | 147000 |
| 78 | Pittsburgh, Pennsylvania | 12.0 | 144000 |
| 79 | Buffalo, New York | 10.7 | 128000 |
| 80 | Cleveland, Ohio | 10.5 | 126000 |
| 81 | Detroit, Michigan | 6.3 | 75000 |
There are so many real estate investment opportunities in the US and in Canada too. Hopefully, these US housing forecasts, predictions and thoughts will help you find those opportunities for the best upside in cash flow, safety and equity appreciation. Be careful with any investment. Do your due diligence.


I think it would be helpful to incorporate the impact of rent control coming into numerous markets in California. The SEIU is trying to get the most stringent rent control measures on 17 different municipalities this year. Rent control will dampen your returns as elected or appointed boards will be allowed to set rates for new projects and regulation will stifle annual increases to cpi. In Sacramento, the measure would actually be appended to the City charter.