US Cities with the Lowest House Prices
You might say there is still an affordable housing migration going on. People are moving to find cheaper housing in their city or in other cities across the US.
As international travel opens up, we may even find more people selling their home and moving internationally.
With respect to the USA, banking rates has ranked the cities with the lowest housing prices. Here are the top 25 where you might find an affordably prices home. Please do check out the employment and economic forecast before selling your home and moving on.
| Metro Area | Median Home Price | % Change 1 Year |
% Change Since Peak* |
% Change Since Bottom† |
Affordability Index
|
| McAllen, Texas | 84,250 | 3.3 | 33.2 | 32.4 | 6 |
| Scranton-Wilkes-Barre, Pa. | 113,050 | 6.3 | -2.2 | 43.1 | 2 |
| Toledo, Ohio | 134,000 | 6.9 | 2.5 | 66.8 | 1 |
| Dayton, Ohio | 135,500 | 8.4 | 8.8 | 62.7 | 1 |
| Lansing-East. Lansing, Mich. | 138,000 | 13.7 | 1.7 | 87.1 | 1 |
| Cleveland, Ohio | 146,000 | 12.7 | 2.5 | 78.4 | 1 |
| Akron, Ohio | 150,000 | 10.1 | 6.3 | 62.8 | 2 |
| El Paso, Texas | 152,192 | 5.3 | 13.6 | 23.9 | 6 |
| Rochester, N.Y. | 153,000 | 16.9 | 44.4 | 60.3 | 3 |
| Little Rock, Ark. | 155,000 | 4.1 | 11 | 16.8 | 1 |
| Memphis, Tenn. | 156,400 | 12.7 | 11.9 | 80.8 | 2 |
| Pittsburgh, Pa. | 158,000 | -0.6 | 24.3 | 38.2 | 2 |
| Buffalo, N.Y. | 160,000 | 16.5 | 85.2 | 77.1 | 4 |
| Greensboro, N.C. | 160,000 | 14.2 | 26.5 | 53.1 | 3 |
| Winston-Salem, N.C. | 165,000 | 12.1 | 22.7 | 55.6 | 3 |
| St. Louis, Mo. | 166,000 | 8.9 | -3.3 | 58.1 | 3 |
| Columbia, S.C. | 166,625 | 8.8 | 16.1 | 49.7 | 3 |
| Augusta, Ga. | 169,000 | 7.5 | 13.8 | 37.2 | 1 |
| Tulsa, Okla. | 169,000 | 7.9 | 23.4 | 37.8 | 2 |
| Kansas City, Mo. | 169,700 | -0.7 | 5.4 | 82.7 | 2 |
| Oklahoma City, Okla. | 170,000 | 6.6 | 34.9 | 35.6 | 2 |
| Harrisburg, Pa. | 175,000 | 12.7 | 16 | 37.9 | 2 |
| San Antonio, Texas | 175,000 | -1.7 | 44.3 | 55.6 | 7 |
Online home search data is showing more out of town searches. People are putting their houses up for sale, in Los Angeles, San Francisco, Washington, New York, New Jersey, Boston, Chicago, Houston, Philadelphia and Atlanta.
And they’re taking their windfall amounts with them to new cities and new neighborhoods. And as more housing becomes available, many who were on the fence about selling, will have somewhere to move to. So the reasons to stay put are disappearing. Many homebuyers and renters will be more mobile this year and continuously looking for cheaper accommodations so they can improve their lives.
A Challenging Search for Homes
Of course, for fleeing home sellers, the challenge is to find houses for sale in many regions that are only now reawakening after 30 years of economic devastation. The rust belt has never looked better for many homebuyers.
Some are finding new construction opportunities, however it won’t be easy for builders to get financing to build homes in economically slow regions.
This means these cities with the lowest prices might not be low for long. The migration will pick up pace for the rest of the year and in the chart below you can see price growth.
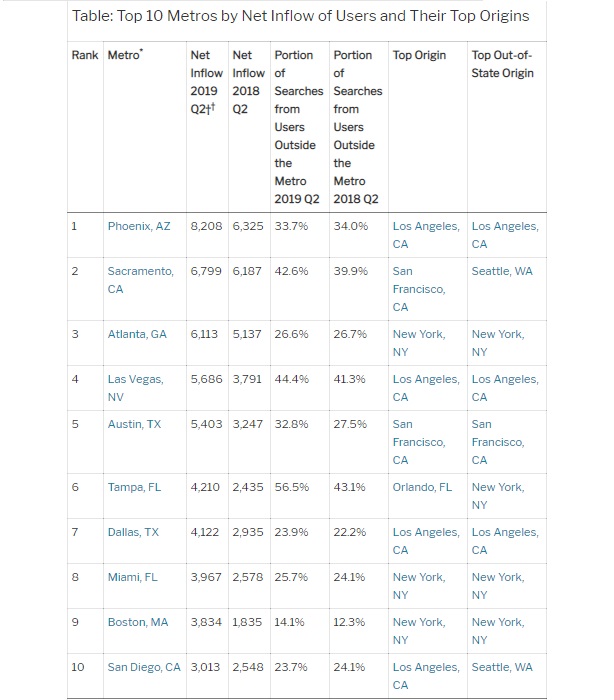
The outward migration of home buyers was first reported last year by Redfin who noticed the migration away from high tax, pricy cities (redfin.com/blog/q2-2019-housing-migration-report/). They found that 2 out of every 5 people searching for houses in Las Vegas were from out of town.
“Out-of-towners continue to gravitate to Phoenix for all of the quality-of-life benefits our area offers: home affordability, low taxes and cost of living, proximity to California and Mexico beaches, and natural beauty,” said Phoenix area Redfin agent Van Welborn from Redfin report.
Back then, Phoenix, Sacramento, Atlanta, Las Vegas, Austin, Tampa, Dallas, Miami, Boston and San Diego were the cities drawing new residents.
Changes in Employment
Today, as the economy slowly recovers, job opportunities change, and oil prices rise, the destination will change. Most home buyers want a home in the country away from the misery of continuous Covid 19 outbreaks, and growing strife in the big metros of New York, Miami, Boston, Washington, Atlanta, Philadelphia, Chicago, and Los Angeles.
The migration out of New York and the Bay Area is powered further by a desire to avoid the high taxation in New York state and California. And renters too are leaving the cities, freed from their desks in Manhattan, Los Angeles, and San Francisco offices. Moving to small towns where rent might be 25% of what they were paying (e.g., New York or the Bay Area) is a godsend for millions of digital nomad “gig workers.”
Buyers Migrating Reasons
⦁ homes cheaper elsewhere
⦁ taxes too high in their home cities and states
⦁ workers freed from the office chains
⦁ rural communities safer from crime
⦁ desire to live in more beautiful, clean and natural surroundings
Where are Buyers Going?
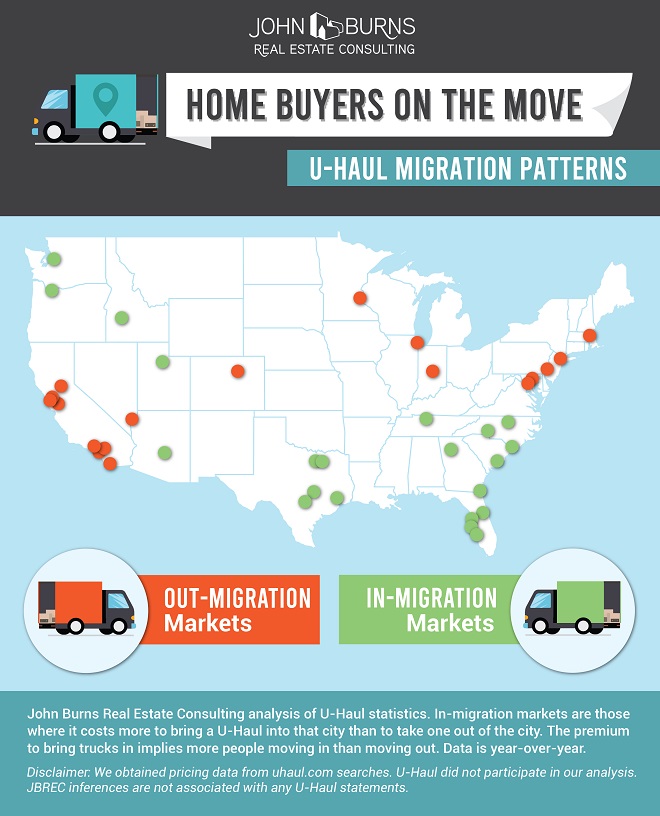
John Burns Real Estate Consulting generated this interesting infographic based on Uhaul searches. The orange dots show where they were leaving and green dots where they’re headed. Hard to validate the science but it’s a creative investigation from John Burns.

Redfin Home Buyers Searches in top 10 Metros
This graphic from Redfin hints at the strength of the homebuyer migration trend.

Kiplinger Report on Cities with the Lowest Home Prices
Kiplinger produced their report on those cities with the lowest home prices. It’s a huge list of cities home buyers will likely be interested in. Pennsylvania, Ohio, Michigan, Alabama, Indiana, Tennessee, Arkansas, and even Texas will attract buyers with these ultra low average prices. Home prices are rising fast in some of the locales. See more data on all housing markets including Chicago, Atlanta, and New York on the US Housing update.
Realtors in these cities will likely have a good second half to their 2021 sales season.
| U.S. Metro Area | Home Price | % Price Change since Peak | % Price Change Since Market Bottom |
| Scranton-Wilkes-Barre, Pa. | $103,000 | 2.4 | 36.1 |
| Toledo, Ohio | $122,000 | -6.6 | 59.8 |
| McAllen, Texas | $124,000 | 35.8 | 37.2 |
| Dayton, Ohio | $128,000 | 5.3 | 57.8 |
| El Paso, Texas | $130,000 | 23.1 | 25.5 |
| Jackson, Miss. | $130,000 | -8.5 | 32.7 |
| Cleveland, Ohio | $135,000 | -13.7 | 67.9 |
| Akron, Ohio | $138,000 | -.5.7 | 65.7 |
| Rochester, N.Y. | $140,000 | 28.5 | 40 |
| Greensboro, N.C. | $145,000 | 10.7 | 44 |
| Indianapolis, Ind. | $145,000 | 12.4 | 63 |
| Little Rock, Ark. | $145,000 | 11.2 | 12.9 |
| Memphis, Tenn. | $147,000 | 2.5 | 64.8 |
| Buffalo, N.Y. | $150,000 | 64.7 | 60.2 |
| Columbia, S.C. | $150,000 | 14.3 | 36.4 |
| Winston-Salem, N.C. | $150,000 | 20.1 | 38.5 |
| Pittsburgh, Pa. | $152,000 | 30.7 | 44.6 |
| Augusta, Ga. | $154,000 | 17.6 | 37.8 |
| Tulsa, Okla. | $154,000 | 17.6 | 30.6 |
| Oklahoma City, Okla. | $158,000 | 30.6 | 32.5 |
| Kansas City, Mo. | $159,000 | -1.3 | 70.2 |
| St. Louis, Mo. | $163,000 | -4.5 | 50.2 |
| Detroit, Mich. | $164,000 | -10.1 | 138.6 |
| Birmingham, Ala. | $165,000 | 2.5 | 55.8 |
| Cincinnati, Ohio | $165,000 | 15.6 | 59.7 |
| Chattanooga, Tenn. | $169,000 | 43.4 | 63.3 |
| Harrisburg, Pa. | $169,000 | 16.9 | 31.9 |
| Louisville, Ky. | $170,000 | 20.2 | 43.9 |
| Lakeland, Fla. | $173,000 | 1.9 | 99.8 |
| Knoxville, Tenn. | $175,000 | 34.8 | 54.3 |
| Baton Rouge, La. | $178,000 | 18.4 | 23.8 |
| Albuquerque, N.M. | $180,000 | 11.7 | 32 |
| Allentown, Pa. | $181,000 | 2.2 | 45.6 |
| Greenville, S.C. | $183,000 | 47.5 | 62.3 |
| San Antonio, Texas | $185,000 | 48.5 | 66 |
| Des Moines, Iowa | $186,000 | 26.1 | 45 |
| Omaha, Neb. | $186,000 | 35.5 | 50.2 |
| Fayetteville, Ark. | $188,000 | 15.7 | 55.5 |
| Columbus, Ohio | $192,000 | 26.4 | 85.3 |
| Grand Rapids, Mich. | $193,000 | 39.8 | 119.7 |
| Milwaukee, Wis. | $193,000 | -3.6 | 58.2 |
| Houston, Texas | $197,000 | 43.9 | 82.2 |
| Albany, N.Y. | $198,000 | 13.1 | 25.9 |
| New Orleans, La. | $199,000 | 30.1 | 74.6 |
| Palm Bay, Fla. | $199,000 | -1.8 | 121.3 |
| Deltona, Fla. | $200,000 | -3.2 | 112.3 |
| Springfield, Mass. | $200,000 | 3.5 | 44.8 |
| New Haven, Conn. | $201,000 | -23.5 | 31.5 |
| Tampa, Fla. | $201,000 | -0.7 | 113.5 |
| Tucson, Ariz. | $206,000 | -4 | 74.8 |
| Jacksonville, Fla. | $208,000 | -0.6 | 85.5 |
| Hartford, Conn. | $214,000 | -10.1 | 14.3 |
| Cape Coral, Fla. | $220,000 | -14.1 | 98 |
| Philadelphia, Pa. | $220,000 | 5.5 | 37.5 |
| Atlanta, Ga. | $225,000 | 14.2 | 123.7 |
| Bakersfield, Calif. | $225,000 | -14.7 | 99.7 |
| Dallas, Texas | $225,000 | 69.4 | 106.8 |
| Charlotte, N.C. | $227,000 | 43.5 | 72.2 |
| Chicago, Ill. | $229,000 | -15.2 | 67.5 |
| Virginia Beach, Va. | $229,000 | -6.1 | 27.9 |
| Richmond, Va. | $233,000 | 16.9 | 55.1 |
| Orlando, Fla. | $235,000 | -6.5 | 112.9 |
| Durham, N.C. | $242,000 | 38.6 | 51.1 |
| North Port-Sarasota, Fla. | $245,000 | -12.1 | 94 |
| Worcester, Mass. | $247,000 | -1.3 | 67.2 |
| Spokane, Wash. | $248,000 | 67.1 | 79.4 |
| Charleston, S.C. | $251,000 | 27.5 | 66.4 |
| Baltimore, Md. | $254,000 | -8.4 | 35.9 |
| Fresno, Calif. | $260,000 | -14.7 | 93.4 |
| Madison, Wis. | $260,000 | 35.6 | 50.9 |
| Raleigh, N.C. | $262,000 | 38.2 | 48.3 |
| Minneapolis-St. Paul, Minn. | $265,000 | 7.4 | 80.8 |
| Nashville, Tenn. | $265,000 | 68.4 | 87.7 |
| Phoenix, Ariz. | $265,000 | -0.8 | 132.2 |
| Providence, R.I. | $268,000 | -8.5 | 80.5 |
| Miami, Fla. | $269,000 | -11.4 | 116.1 |
| Las Vegas, Nev. | $275,000 | -16 | 151.4 |
| Ogden, Utah | $278,000 | 81.7 | 93.2 |
| Boise City, Idaho | $290,000 | 48.7 | 161.9 |
| Austin, Texas | $299,000 | 93.3 | 91.5 |
| Colorado Springs, Colo. | $304,000 | 49.8 | 80.2 |
| Salt Lake City, Utah | $310,000 | 95.8 | 133.3 |
| Modesto, Calif. | $315,000 | -16.3 | 149.7 |
| Provo, Utah | $340,000 | 77.6 | 105.2 |
| Riverside-San Bernardino, Calif. | $355,000 | -9.9 | 110.2 |
| Stockton, Calif. | $355,000 | -14.5 | 155.1 |
| Bridgeport, Conn. | $374,000 | -19 | 28.7 |
| Portland, Ore. | $385,000 | 49 | 94.5 |
| Washington, D.C.-No. Va. | $397,000 | -8.2 | 47.7 |
Above data courtesy of Kiplinger Reports.
Realtors, don’t forget to check out Realtor marketing packages to build buyer and seller leads this year and beyond. See yourself as a market leader and it might come true.
See more on the current Real Estate Market, the Bay Area Housing Market and the Florida Real Estate Market.
Will the Housing Market Crash? | Will There be a Stock Market Crash? | Will Home Prices Go Down?
Stock Market Predictions | Google Stock Price | Google Finance | Stocks Next Week | 6 Month Outlook | Stock Prediction Software | Travel Software Marketing | Bleisure Travel Marketing | Travel Management Software | SaaS Marketing | Travel Marketing | Business Travel Marketing | Travel SEO

