Zillow’s Hottest Cities List
According to Zillow’s latest report on home prices, cities in the upper midwest accounted for 6 of the 7 cities with the largest home price gains in May.
They found that Columbus, Cincinnati, Detroit, Richmond and Milwaukee saw the highest price gains.
West Coast cities bucked their losing trend in home prices by posting slight gains. San Jose prices rose 1.9%, while San Francisco prices rose 1.4% and Seattle home prices rose 1.7%.
Year over year, Richmond VA (+5.77%), Miami FL (+5.38%), Oklahoma City (+4.92%), Kansas City MO (+4.08%), and Cincinnati (+4.03%) lead the way in price growth.
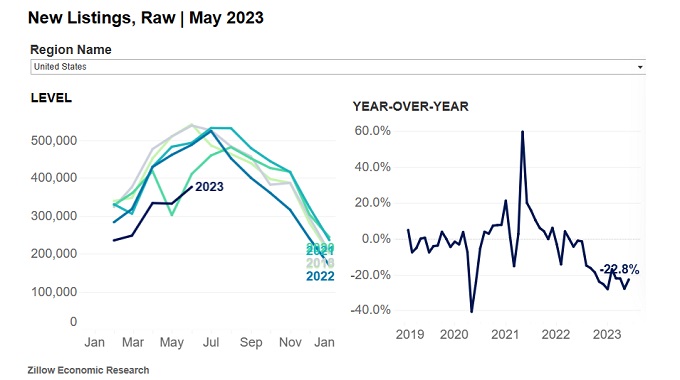
Zillow noted just as Redfin did in their June report that there were fewer homes listed in May. Redfin’s housing report revealed the number of homes for sale in the U.S. fell 7.1% year over year to 1.4 million on a seasonally adjusted basis in May and new listings fell 25% to the third lowest level on record.
Zillow showed there were 23% fewer listings after 28% declines in April, and 22% annual decline in March.
Home Sales
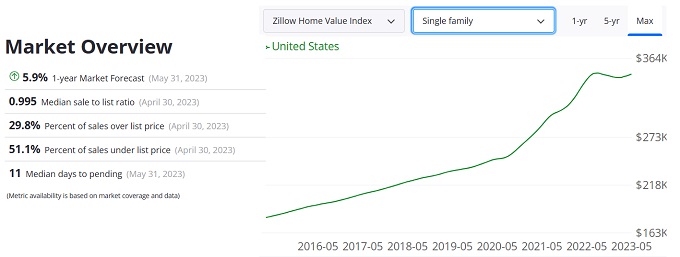
Zillow’s report quotes NAR’s housing sales reports that 4.3 million existing homes were sold in May 2023, up 0.2% from April 2023, and down 20.4% vs May 2022.
Like Redfin, Zillow points to homeowners not being able to let go of sub-4 % mortgages for new ones at above 6%. So they’re not willing to sell or buy another home until rates begin to fall.
Total active inventory recording by Zillow fell 3.1% in May, which is down 45.7% from pre-pandemic levels.
Newly pending listings rose 9.5% vs April, making the year over year drop 18% in May. The 295,000 listings were pending in May. Their charts however show a steady growth from record lows late in 2022.
Zillow reports rent prices climbed .6% in May, a normal seasonal rise. They are up 4.8% from last May 2022, and are up 1.9% YTD. The average rent price reached an all-time high at $2048 per month, yet the rate of growth continues to fall, but is still up 4.7% year over year.
Rent prices like home prices do factor into consumer price inflation readings.
Annual rent growth was highest in Cincinnati (7.9%), Boston (7.7%), Providence (7.5%), Kansas City (6.9%), and Louisville (6.8%).
On a year-over-year basis, rents are down 1.4% in Las Vegas, and have increased the least in Phoenix (0.4%), Austin (0.8%), Salt Lake City (1.5%), and Sacramento (1.6%).