Los Angeles Housing Market
June’s sales data for the Los Angeles housing market doesn’t really tell us anything new, however prices jumped in June which may lead us to believe the market has some health.
The exodus of people and businesses have hurt the LA economy, yet as interest rates drop, that trend may stop and you’ll see an influx of out of state buyers investigated a home purchase here. Demand has been crushed, but those buyers are still checking the homes for sale listings and preparing for their bid as mortgage rates drop and the economy regains its footing.
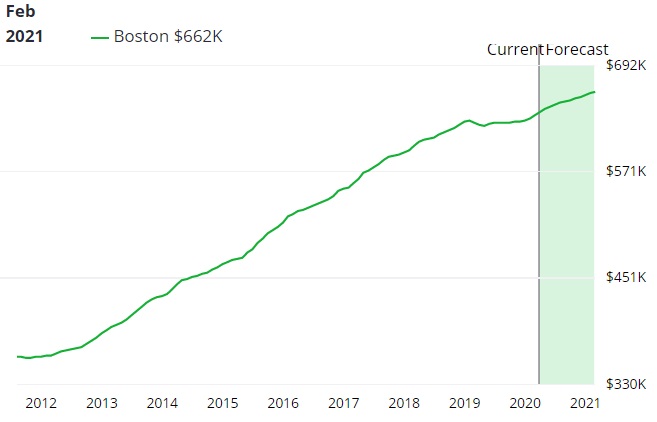
The 11.8% jump in housing prices in June hints at what might be in the Los Angeles housing market forecast for 2024/2025.
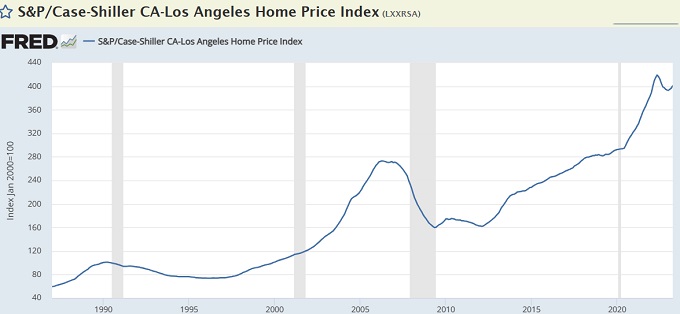
The LA home price history chart below shows where prices have come from and the rate effects of the last 12 months. Can the FED continue to suppress the economy and real estate markets when so much is on the line? The answer may be that they can’t for reasons shown in the US national housing report.
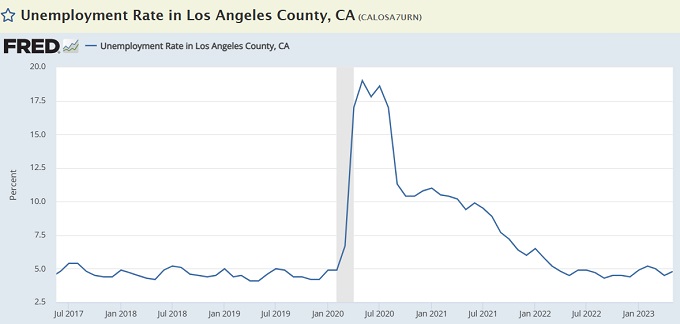
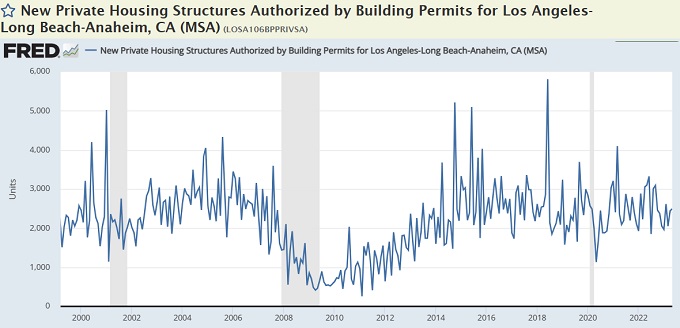
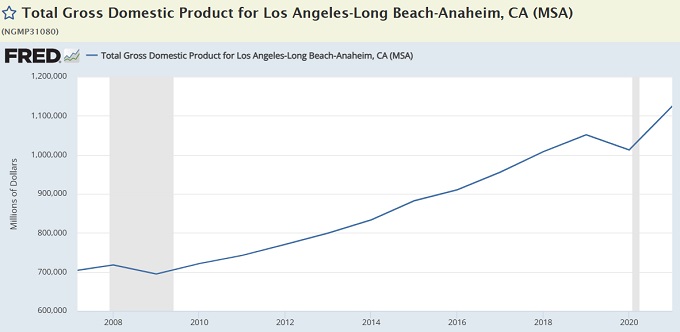
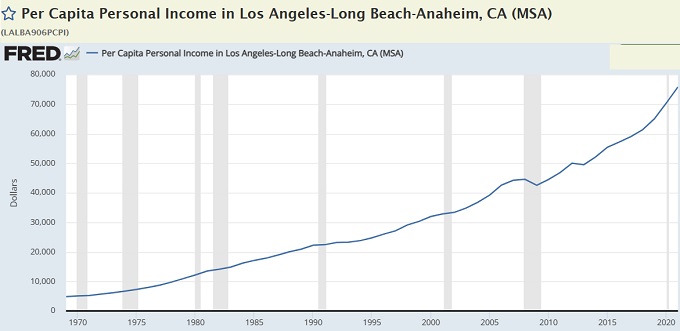
Los Angeles Economic Indicators
These charts show continuous strength of the LA economy and the ability to purchase homes. It can be said that the LA economy is injured by high interest rates, so the receding rates will allow this economy to breathe. Why will this be the case? Because Americans are exhausted by tightening practices of the Biden regime, and there is an election in November 2024.
Buyers and sellers are still stressed about the severe lack of supply, sky-high prices, and high mortgage rates that all seem so intractable. Yet, with receding interest rates not far off, we’ll see more supply come onto the market. In June, there were 20,351 homes listed for sale with an average DOM of 37 days.
Home prices rose in June to $832,310, a jump of 11.8% ($96,000) over May. That makes Los Angeles one of the outliers in performance in the California housing market during the month.
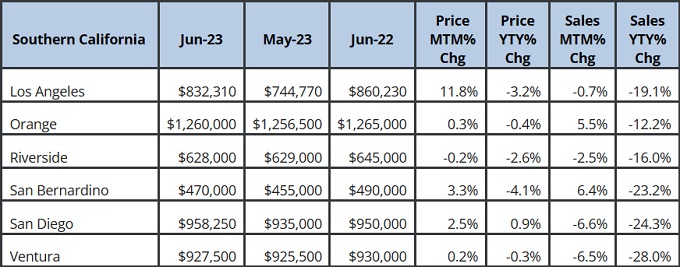
As you’ll see in the city-by-city comparison chart below, price and DOM vary widely in Los Angeles County.
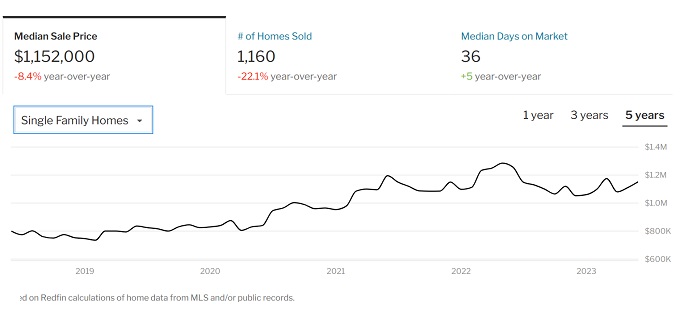
1,736 homes sold in June this year, down from 2,306 in June of 2022. That’s down 24.7%. Days on market has risen by 5 days vs 12 months ago.
However, prices were soaring from March to June of 2022, until the rate hikes spoiled the party.
Redfin data shows the sales-to-list price ratio is still above 100% at 101.4% (down 2.9%) and homes sold above list prices dropped 14.1% to 50.2%.
C.A.R’s June Residential Report Just Released
Existing single family homes in Metro LA rose $12,000 in June (+1.3%) while sales grew .5%.
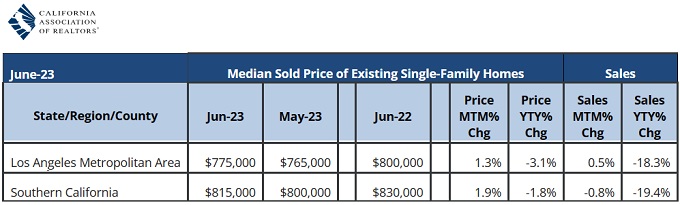
CAR in its new June market report shows Los Angeles county house prices rose almost $86,000 ( +11.8%) in the last month alone.
That’s quite a jump and only 3.2% less than one year ago. Sales declined slightly by .7%, and are down 19.1% YoY.
Condo prices in Metro LA grew $9,000 vs May (+1.5%) while sales fell 7.3% (-23.6% YoY). Condo/townhomes across all of LA county rose 2.4% (+$15,000) and are up 4.2% YoY while sales plunged 6.5% (-22.4% YoY).
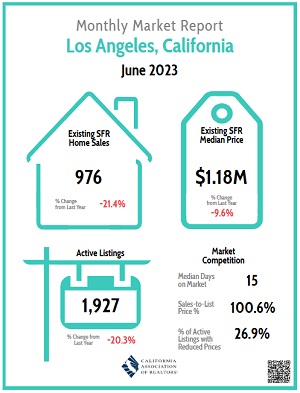
In the city of Los Angeles, CAR reports 976 home sales (down 21.4%) at a median price of $1.18 million (down 9.6%).
Comparison of California Cities
Check a comparison of cities in LA county below. You can drill down in more detail at the Realtor.com website.
| City | Home List Price | Median Sold Price | Sale to list Price % | Days on Market |
| Agoura Hills | $1,500,000.00 | $990,000.00 | 102.2 | 34 |
| Alhambra | $800,000.00 | $840,000.00 | 101.60% | 29 |
| Arcadia | $1,600,000.00 | $1,300,000.00 | 99.7 | 35 |
| Artesia | $819,000.00 | $775,000.00 | 100.1 | 48 |
| Avalon | $150,000.00 | N/A | 68 | |
| Azusa | $700,000.00 | $633,000.00 | 101.8 | 32 |
| Baldwin Park | $649,000.00 | $634,000.00 | 102.4 | 35 |
| Bell | $694,000.00 | n/a | 52 | |
| Bellflower | $755,000.00 | $787,500.00 | 100.5 | 35 |
| Beverly Hills | $7,000,000.00 | $3,300,000.00 | 97.6 | 65 |
| Bradbury | $6,700,000.00 | n/a | 76 | |
| Burbank | $1,200,000.00 | $1,200,000.00 | 100.8 | 23 |
| Calabasas | $2,600,000.00 | $1,800,000.00 | 96.8 | 43 |
| Carson | $750,000.00 | $730,000.00 | 102 | 30 |
| Cerritos | $1,100,000.00 | $1,100,000.00 | 100 | 24 |
| Claremont | $908,000.00 | $9,680,000.00 | 101.8 | 29 |
| Commerce | $589,000.00 | $600,000.00 | 100 | 40 |
| Compton | $580,000.00 | $579,000.00 | 101 | 42 |
| Covina | $770,000.00 | $730,000.00 | 102.3 | 29 |
| Culver City | $1,400,000.00 | $1,200,000.00 | 103.8 | 36 |
| Diamond Bar | $1,100,000.00 | $905,000.00 | 100.8 | 43 |
| Downey | $860,000.00 | $753,000.00 | 101.6 | 27 |
| Duarte | $740,000.00 | $720,000.00 | 100 | 35 |
| El Monte | $699,000.00 | $700,000.00 | 100 | 36 |
| El Segundo | $2,000,000.00 | $1,100,000.00 | 100.8 | 36 |
| Gardena | $782,000.00 | $742,000.00 | 100.4 | 31 |
| Glendale | $1,200,000.00 | $1,100,000.00 | 103.5 | 34 |
| Glendora | $895,000.00 | $849,000.00 | 100.7 | 29 |
| Hawaiian Gardens | $539,000.00 | n/a | 31 | |
| Hawthorne | $872,000.00 | $805,000.00 | 100 | 39 |
| Hermosa Beach | $2,700,000.00 | $2,400,000.00 | 98.3 | 65 |
| Hidden Hills | $94,000,000.00 | n/a | 66 | |
| Huntington Park | $630,000.00 | $584,000.00 | 100.2 | 29 |
| Inglewood | $800,000.00 | $715,000.00 | 100.1 | 42 |
| La Habra Heights | $2,100,000.00 | $1,300,000.00 | 96.5 | 48 |
| La Mirada | $775,000.00 | $855,000.00 | 101.2 | 29 |
| La Puente | $690,000.00 | $730,000.00 | 100.9 | 32 |
| La Verne | $975,000.00 | $935,000.00 | 100 | 29 |
| Lakewood | $809,000.00 | $840,000.00 | 102.5 | 22 |
| Lancaster | $485,000.00 | $446,000.00 | 100 | 35 |
| Lawndale | $750,000.00 | $830,000.00 | 100 | 36 |
| Lomita | $787,000.00 | $785,000.00 | 102.5 | 28 |
| Long Beach | $779,000.00 | $761,000.00 | 100 | 36 |
| Los Angeles | $1,200,000.00 | $959,000.00 | 100 | 39 |
| Lynwood | $645,000.00 | $635,000.00 | 99.7 | 45 |
| Malibu | $6,800,000.00 | $2,500,000.00 | 96.8 | 63 |
| Manhattan Beach | $3,300,000.00 | $3,000,000.00 | 99 | 57 |
| Monrovia | $1,000,000.00 | $90,000.00 | 100 | 38 |
| Montebello | $729,000.00 | $717,000.00 | 100 | 37 |
| Monterey Park | $919,000.00 | $894,000.00 | 105.1 | 32 |
| Norwalk | $690,000.00 | $694.00 | 101.6 | 29 |
| Palmdale | $520,000.00 | $485,000.00 | 100 | 36 |
| Palos Verdes Estates | $3,000,000.00 | $2,700,000.00 | 99 | 39 |
| Paramount | $561,000.00 | $615,000.00 | 101.5 | 31 |
| Pasadena | $1,200,000.00 | $1,100,000.00 | 100 | 38 |
| Pico Rivera | $685,000.00 | $685,000.00 | 102.5 | 27 |
| Pomona | $600,000.00 | $630,000.00 | 101 | 41 |
| Rancho Palos Verdes | $1,900,000.00 | $1,800,000.00 | 101.4 | 31 |
| Redondo Beach | $1,400,000.00 | $1,400,000.00 | 100.7 | 32 |
| Rolling Hills Estates | $1,900,000.00 | $2,100,000.00 | 100 | 35 |
| Rosemead | $800,000.00 | $800,000.00 | 104.8 | 48 |
| San Dimas | $842,000.00 | $861,000.00 | 101 | 24 |
| San Fernando | $720,000.00 | $670,000.00 | 100.7 | 37 |
| San Gabriel | $1,100,000.00 | $922,000.00 | 103.7 | 28 |
| San Marino | $3,400,000.00 | $2,800,000.00 | 100.7 | 48 |
| Santa Clarita | $785,000.00 | $760,000.00 | 100.3 | 29 |
| Santa Fe Springs | $710,000.00 | $725,000.00 | 100.4 | 34 |
| Santa Monica | $2,200,000.00 | $1,700,000.00 | 100 | 44 |
| Sierra Madre | $1,700,000.00 | $1,200,000.00 | 102 | 31 |
| South Gate | $595,000.00 | $845,000.00 | 103.2 | 33 |
| Temple City | $998,000.00 | $1,100,000.00 | 101.5 | 34 |
| Torrance | $935,000.00 | $1,100,000.00 | 101.8 | 30 |
| West Covina | $830,000.00 | $750,000.00 | 102.2 | 29 |
| West Hollywood | $1,600,000.00 | $921,000.00 | 100 | 44 |
| Westlake Village | $1,800,000.00 | $1,400,000.00 | 99 | 36 |
| Whittier | $769,000.00 | $765,000.00 | 103 | 28 |
| Data courtesy of Realtor.com | ||||
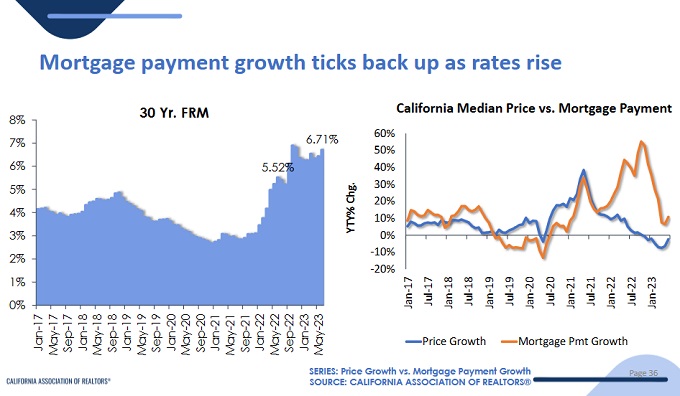
Mortgage Rates Climbing Again
June 30 year fixed mortgage rates are back up above 7%.
Los Angeles Housing Market
Buyers will want to learn more about the full US real estate forecast and what is driving the overall California housing market and the markets in San Diego, San Francisco, San Jose and Sacramento.
Los Angeles Housing Forecast 2024 and Beyond
LA’s real estate forecast is highly dependent on the FED interest rate schedule given that affects mortgage prices and slows the economy. A lack of supply at the lower end means any boosts in economic activity and lower rates will cause prices to rise dramatically. Speculators may jump into the fray when they can.
Luxury million dollars homes have been seeing lower prices as when Ben Affleck and Jennifer Lopez reportedly saved $14 million on their recent purchases in Beverly Hills.
National and international economic trends too, will impact the amount of business done through the LA area including imports from Asia.
The commercial real estate sector could pose a threat, with some believing it could see 40% drops in value, and that means the multifamily sector is in for some suffering in the next 12 months before lower interest rates are felt.
Yet last month’s 11.8% rise in price shows Los Angeles sees continuous demand and its inadequate housing supply is almost a guarantee that the house or rental property you buy will appreciate in 2024/205 as mortgage rates decline.
Could the Los Angeles Housing Market Crash?
Prospective buyers have similar questions such as when will home prices fall, or will the LA housing market crash, or where can I find an affordable house in Los Angeles?
California Housing Market
Sales within the California housing market are slumping with the exception of the San Francisco region. However, sales are up strongly year over year. Buyers are finding some reprieve in prices.
Lack of Affordable Housing is Holding the Market Down
Low home affordability continues to depress buyer demand in Los Angeles and across California. High prices combined with lofty mortgage rates makes it a tough time for buyers.
High cost of living and too high real estate prices have some businesses exiting for Arizona, Florida, Colorado, and Texas. That exodus may keep home prices from running away again this summer. This is the same issue in San Francisco Bay Area, San Diego, Sacramento, Florida, Denver, Chicago, and Seattle where buyers simply can’t afford the lower end of the detached housing market.
Here’s the Hottest Zip Codes in Los Angeles
Here’s the LA Times hot zip code list:
Santa Monica 90402 – Average home price: $3,237,500
Hermosa Beach 9025 – Average home price: $1,693,500
Lincoln Heights/Montecito 90031 – Average home price $458,500 +14.6%
City Terrace 90063 – Average home price: $320,000 +18.5%
Marina Del Rey 90292 – Average home price: $2,157,500 +23%
Manhattan Beach 90266 – Average home price: $2,100,000 +10%
Compton – 90220 – Average home price: $285,000 +9.8%
Playa Del Rey 90293 – Average home price: $1,517,500 +26.5%
Toluca Lake Studio City 91602 – Average home price: $1,022,500
Read more on the best zip codes in the US for investors and homebuyers.
Is there a Housing Market Bubble?
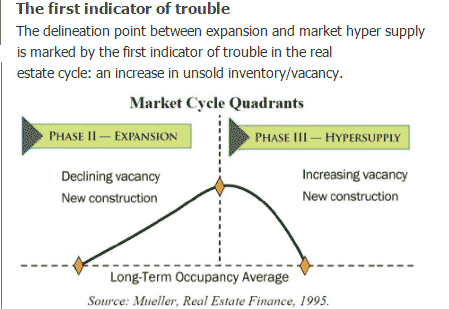
Do you believe we’re in a California housing bubble? According to a Harvard real estate guru, bubbles don’t burst until demand dries up — an increase in unsold inventory and that’s not what’s happening.
The lack of supply will prevent a severe downturn, although trouble in Washington DC may lead to a price drop. California and Los Angeles own debt problems are an added concern. If not for the pandemic fund transfers, California would be in serious trouble.
With the 10 year drought ending, the agriculture community should prosper through the next 5 years. As you’ll see from the data in this post below, there is huge demand for property. Supply is the problem.
Factors Affecting House prices and Availability in LA
- Housing Demand – Demand from those with wealth for single family detached, and luxury homes
- Housing Supply – Throttled, supply is far from what’s needed even if growing
- Mortgage Rates – rising creating very high mortgage rates
- Down Payment and mortgage rules – Banks are withdrawing FHA loans however some were offering down payments as low as 3%
- Regional Employment – Very low and remaining low
- Buyer Income – low and not rising enough to keep up with inflation
- Home Prices – High and rising – out of reach for many buyers – many consider LA homes grossly over-priced
- Demographics – Millennials coming into family and home buying years and LA millennials have had the lowest rate of home buying (pent up demand)
- Number of Renters – increasing fast
- New Home Construction: slow (100k to 140k per year)
- Economic-Foreign Trade – deglobalization and reduced international trade may slow job growth in tech, but agricultural demand may increase
- Election Year – mid term elections may see Republicans sweep to power
- Taxes on Sale of Home – Taxes are a big concern for buyers
- Sellers leaving California for low tax states including Florida and Texas.
Good luck with your pursuit of a home in California. 2024 might provide better buying opportunities.
See additional housing market forecast reports on San Diego CA , Denver, Austin, and San Francisco CA. See the California and Florida market reports.