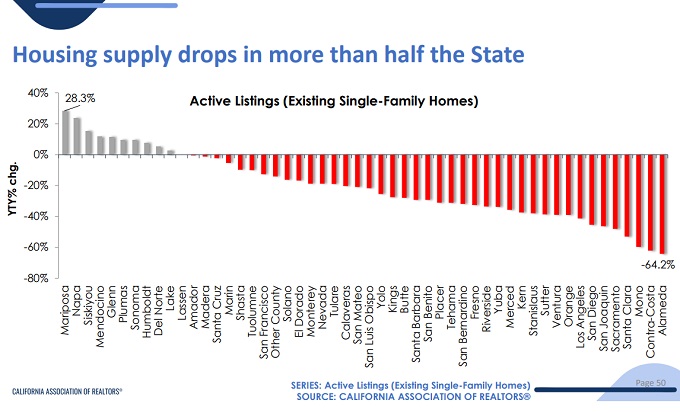
Sales Growth in the California Housing Market
When home supply dips below 5 months inventory, it’s said to be a sellers market.
In California in July, home inventory hit 2.9 months supply, up from 2.5 months last July, making the Golden State clearly a long way from being a buyer’s market. Despite intense demand, unsold inventory of homes is up 16% from 12 months ago.
It’s not an easy market to generate forecasts for, given the politics and fragile economics of the day, but both home sales and prices will likely climb in 2025. The exodus of Californians is slowing and with lower interest rates, California’s powerful economy will roll once again. We’re at an inflection point where past stats will mean very little as buyers resume their quest for homeownership in the Golden State.
In stark contrast to many states and cities in the US (Boston) and Canada (e.g., Toronto) California saw its home sales grow 3.6% vs June, while prices fell for both houses and condos. Redfin reports that home price drops leapt upward in July to 29.2% of homes, +6.9% YoY, in July.
July’s sales numbers were up 4.1% from 12 months ago (270,200 vs 268,840 annualized) and up 3.6% from June. Let’s take a fresh, updated look at what is still the most fascinating housing market, at a time of massive economic change in America.
In this Month’s Market Report:
Buyers Await Anxiously
July’s Sales Activity and Price Growth Report
Luxury Market Picking Up
Condo Sales in July
What’s Driving CA Home Sales
Zillow Report — Current CA Home Prices
Beautiful California so Hard to Resist
2025 Housing Market Forecast
New Home Construction California 2023
Positives and Negatives Driving CA Home Prices
Where are Californians Moving To?
CalMatters on the Real State of Real Estate in CA
Sellers Still Locked In, Buyers Locked Out
Realtors Sentiment in August
California Home Price Growth 2017 to 2023 by County
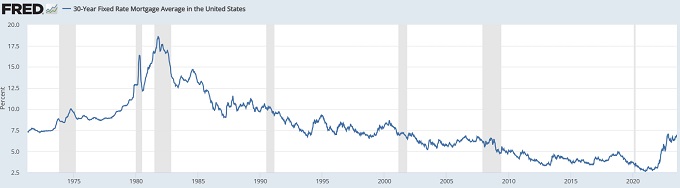
Buyers Anxiously Await Lower Mortgage Rates
With a slight reduction in mortgage rates down below 7% in July, buyers and sellers are anticipating the FED cuts in their September meeting. A reduction in lending rates would boost Florida’s housing market, Texas’ housing market and all others across the US.
The awakening of the US housing market after it’s worse year since 1978, will be just one of the big economic events to allow the US economy and real estate sector to come alive. Of course, California’s commercial and office sector is in dire trouble, as businesses, investors and entrepreneurs evacuate the state for lower taxes and lower costs of doing business elsewhere.
July’s Sales and Price Report

C.A.R. President Melanie Barker, a Yosemite REALTOR® said “Despite transitioning into the off-season, the market should remain vibrant in the coming months if the availability of homes for sale continues to improve, and mortgage rates moderate further in the third and fourth quarters.” in the California Association of Realtor’s July report.
Home prices in contrast slipped 1.6% in July to a new media price of $886,560, down about $4,000 from June. The monthly decline reflects a slight improvement in mortgage rates and the rise in listings and inventory against a pool of non-enabled buyers waiting perhaps for a bargain and better financing opportunities.


Luxury Market Picking Up
Homes in the higher priced, luxury market rose significantly, while homes in the affordable range dwindled. Sales in the $1 million+ level rose an astonishing 25% year over year. Redfin reported this month that nationwide, luxury home sales are flat in the US, while non-luxury home sales slumped. It may be that the wealthy have done well in the stock market and California high priced home sellers are ready to sell.

Condo Sales in July
Condo Townhomes across the state dropped 2.4% in price during July, while sales grew an impressive 8.5%.
In Metro LA, the growth was much stronger at 12% MoM. New listings help to decrease prices by 2.7%. Year over year, condo prices are still up 5.4% statewide, while in greater Los Angeles, prices are up 4.3% YoY.

The highest drop in condo prices in July were in Napa (-32%), Santa Clara (011.6%), Monterey (-19.7%), San Bernardino (-22%), Santa Barbara (-11.3), Santa Cruz (-12%), and Sonoma (-7.4%).
San Mateo (+3.3%), Marin (+15.6%), and San Francisco (+13.5%) enjoyed the largest condo price gains last month.
Napa saw a 50% drop in sales with Marin seeing a 21.2% drop.
Across Southern California, condo townhouse prices fell 2.1% from $677,000 to $661,350.
What’s Driving CA Home Sales Right Now?
It’s most likely the cost of living is simply too painful and Californians need to move out of state to get relief. Given California has the most pricey real estate, sellers are at least able to get more house and land for the dollar when they move to Arizona, Texas, Florida, Tennessee, or other low tax states.
Being free of California’s monster taxes is the passion of many sellers, and Realtors might be focusing on that end in their marketing campaigns to sellers. Being sympatico with sellers is the key to gaining their confidence. Recent changes in the rules for Realtors puts the emphasis on the sell side, and highlights the importance of seller leads to agents.
Zillow Report — Current CA Home Prices
Zillow provides an alternative view of California residential real estate with its July report showing single family house prices reaching a record $803,798.

Redfin’s Price Report
Redfin’s most recent report show California is indeed a seller’s market, and might always be. Home prices rising strongly, up to $887,500 yet with a big 8.7% decreased in homes sold versus July 2023. Days on market rose by 2 days showing a tougher market.

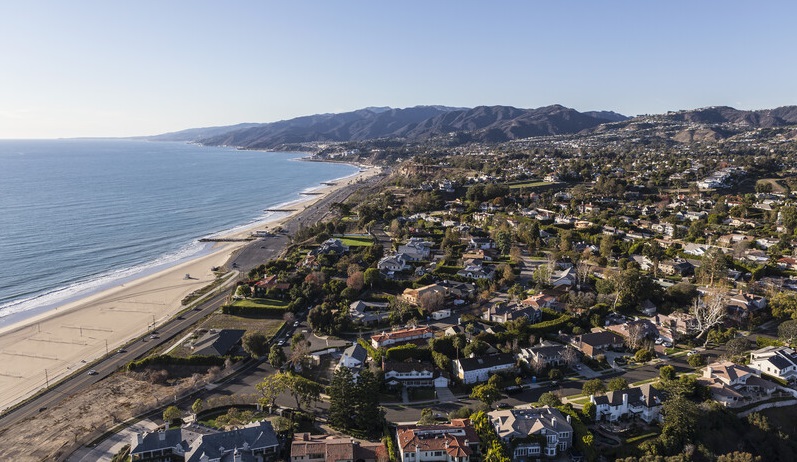
Beautiful California so Hard to Resist

Despite the disastrous situation in this state’s politics and governance, buyers still climb over themselves to get at whatever properties are listed for sale. If not for mortgage issues, home prices would be higher still, and there are indications this housing market is beginning to turn the corner to recovery.
The attractiveness of California might be considered a curse, since it allows some politicians and government managers to do borrow excessively and raise taxes to the moon.
Even for California, few believe the housing market is in store for a 2008 style crash. The banking system is better this time around and the US economy is ready to spring back strongly. $5 trillion in money markets may not move to the stock market, but instead could move to the real estate market. And as interest rates recede, the tech sector will move into high gear.
Still, an agonizing period of suppression and pain for buyers and sellers remains for the next 6 months, until mortgage rates drop appreciably (perhaps 200 basis points by summer 2025. This is when a housing boom is more likely. In CA, one major hurdle remains — anti-development real estate laws. What is being done to free up this state?
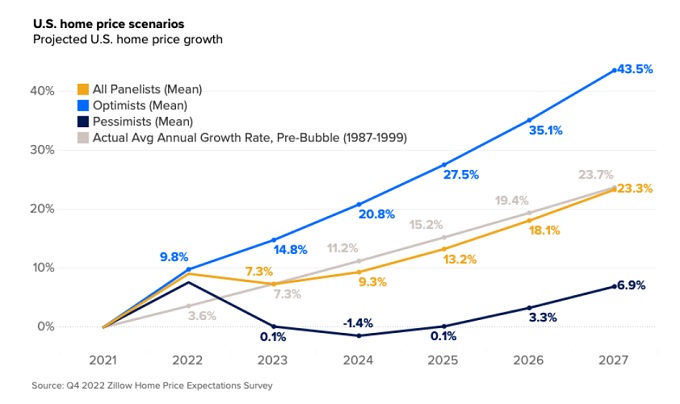
2025 Housing Market Forecast
Before we dig into the less-than-optimal conditions in the CA markets, let’s see what Zillow’s experts say about the road ahead for the US housing market. The most optimistic are predicting average price hikes in the 30% range while the pessimists see only a 6.8% hike over the next 4 year period. The negative outlooks though don’t make sense. The US is positioned for tremendous growth with the repatriation of manufacturing to the US, the Chips Act, and interest rates will decline in 2024. California is over its painful, lengthy rain drought and the Silicon Valley tech sector should come back in the next few years.
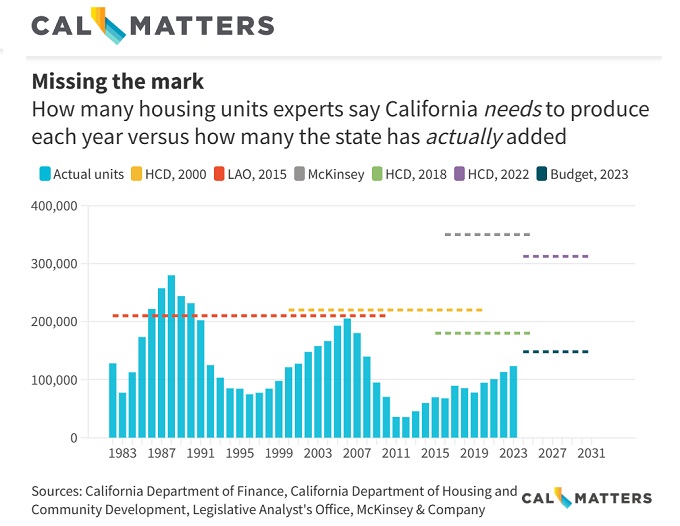
New Home Construction California 2023
Despite claims, this chart from FirstTuesday using US Census data clearly shows decreasing new house and multifamily construction this year.

Positives and Negatives Driving CA Home Prices
There’s so much happening in the Golden State that even housing experts and economists can easily get lost in the details and lose sight of its true direction. This post might provide a more clear view for buyers trying to time a purchase and sellers wanting to sell at the right time in 2024.
The state’s faltering economy, high cost of living, excessive regulations, and crippling taxes have made more Californians leave the state for greener pastures. Add on forest fires and inability to acquire home insurance, and the frustration and worry for some can be unhealthy. And with all of that, the state reported it has created more homes than at any time since 2008. Yet times have changed with new types of buyers with different needs in 2024 especially an affordable price.
Besides its incomparable climate and geodiversity, what separates the Golden State from New York, Florida, Texas, Arizona, Georgia, Massachusetts, etc. is its onerous housing regulations and anti-housing development sentiment. The state keeps finding ways to create laws to make it worse (e.g. mansion taxes, exit taxes, proposition 13).
The housing shortage in CA continues causing massive increases in price and making any homes for sale, anywhere in the state, a holy grail for Californians. For buyers, almost nothing favors them in their quest to buy their dream home in California. Yet, if those who exited for Texas, Florida, Arizona, Oregon, Utah, etc. hadn’t left, this market would be unbearable.
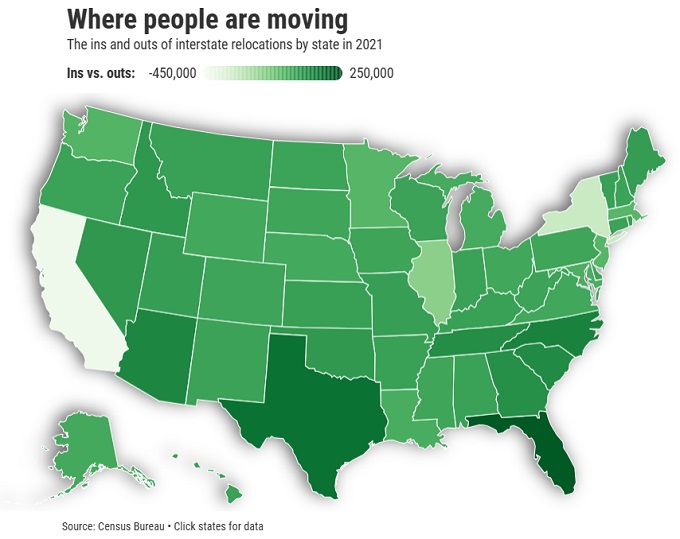
Where are Californians Moving To?
Redfin reports people are moving out of Los Angeles and San Francisco at a fast pace, while Sacramento and San Diego are still attractive for incoming people.

This chart from the Orange County Register where Californians are relocating to: Texas, New Mexico, Florida and North Carolina. There’s still that question though, that if you’re in technology, can you leave the Bay Area? It’s still the major center for software technology? Or is Texas zero tax culture just too much to ignore?
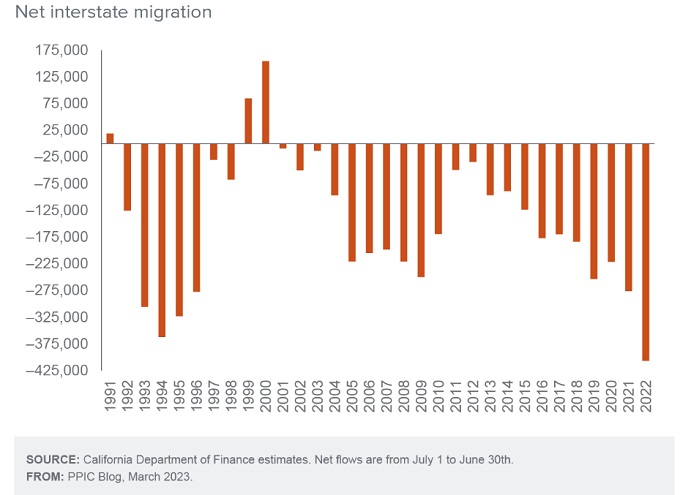
CalMatters on the Real State of Real Estate in CA
Calmatter’s Interstate Migration report shows a strong, growing trend of out-migration. The report hasn’t been updated, perhaps due to brand damage to California’s government. Newer data shows the outbound migration is slowing but still in excess of 144,000 per year. Overall, CA’s population has declined by about 400,000 vs 2020.
The June home resale report from CAR shows continued strength in home and condo prices, yet sliding sales. Sales are down due to prices, but also due to credit tightening and higher mortgage rates which are locking sellers into their homes.
Sellers Still Locked In, Buyers Locked Out
CAR’s sales chart shows it was bad as the Great Recession.
It’s a hint of madness in many levels of government who pride themselves on being progressive and innovative, when the miserable starkness of the truth in the 2024 real estate scene says otherwise.

Macroeconomic fundamentals still drive housing markets from San Diego to Los Angeles to the Bay area. And the anti-housing lobby supercharges prices further higher as more buyers seek to avoid the risk of renting. And many more rental properties are being purchased by buyers thus diminishing the rental market.
Realtors Sentiment in August
Realtors are expressing some pessimism about sales, prices and listings.

While mortgage rates likely aren’t going to drop, they will likely not go higher. That stability might help some buyers make their decision to buy this year.
Realtors will need better strategies on how to get homeowners to sell their homes.
California Home Price Growth 2017 to 2023 by County
Pandemic era boost in price has given Californian homeowners massive equity growth.
| Home Price Growth in California Counties | ||||||
| California County | Median Price July 2024 | Median Price June 2023 | Price Change from 12 months ago | Median Price May 2020 | Median Price 2017 | 7 Year Price Change |
| Alameda County | $1,280,000 | $1,305,000 | -1.92% | $955,000 | $834,500 | 53.39% |
| Butte County | $430,000 | $413,000 | 4.12% | $362,000 | $329,500 | 30.50% |
| Contra Costa County | $916,500 | $930,000 | -1.45% | $690,000 | $570,750 | 60.58% |
| Fresno County | $420,000 | $429,000 | -2.10% | $295,000 | $265,000 | 58.49% |
| Kern County | $413,000 | $380,000 | 8.68% | $270,000 | $220,000 | 87.73% |
| Los Angeles County | $909,010 | $832,000 | 9.26% | $546,930 | $581,000 | 56.46% |
| Madera County | $424,350 | $447,000 | -5.07% | $297,500 | $240,500 | 76.44% |
| Marin County | $1,594,000 | $1,700,000 | -6.24% | $1,500,000 | $1,015,000 | 57.04% |
| Merced County | $413,500 | $390,000 | 6.03% | $285,000 | $275,000 | 50.36% |
| Monterey County | $945,000 | $796,000 | 18.72% | $650,000 | $582,000 | 62.37% |
| Napa County | $1,052,500 | $840,000 | 25.30% | $672,500 | $635,000 | 65.75% |
| Nevada County | $609,480 | $574,000 | 6.18% | $410,000 | $400,000 | 52.37% |
| Orange County | $1,390,000 | $1,260,000 | 10.32% | $834,550 | $708,500 | 96.19% |
| Placer County | $670,000 | $680,000 | -1.47% | $515,000 | $485,000 | 38.14% |
| Riverside County | $650,000 | $628,000 | 3.50% | $434,480 | $380,000 | 71.05% |
| Sacramento County | $560,000 | $530,000 | 5.66% | $395,000 | $355,000 | 57.75% |
| San Bernardino | $515,000 | $470,000 | 9.57% | $320,000 | $329,750 | 56.18% |
| San Diego County | $1,020,000 | $960,000 | 6.25% | $655,000 | $550,000 | 85.45% |
| San Francisco County | $1,600,000 | $1,600,000 | 0.00% | $1,627,500 | $1,325,000 | 20.75% |
| San Joaquin County | $585,000 | $530,000 | 10.38% | $415,000 | $386,500 | 51.36% |
| San Luis Obispo County | $1,035,000 | $865,000 | 19.65% | $632,500 | $599,000 | 72.79% |
| San Mateo County | $2,100,000 | $2,040,000 | 2.94% | $1,650,000 | $1,250,000 | 68.00% |
| Santa Barbara County | $827,500 | $1,200,000 | -31.04% | $637,500 | $545,000 | 51.83% |
| Santa Clara County | $1,880,000 | $1,800,000 | 4.44% | $1,365,000 | $1,000,000 | 88.00% |
| Santa Cruz County | $1,355,000 | $1,200,000 | 12.92% | $850,000 | $727,000 | 86.38% |
| Shasta County | $394,450 | $385,000 | 2.45% | $297,000 | $244,500 | 61.33% |
| Solano County | $586,400 | $590,000 | -0.61% | $482,000 | $415,000 | 41.30% |
| Sonoma County | $850,000 | $850,000 | 0.00% | $675,000 | $595,000 | 42.86% |
| Stanislaus County | $485,000 | $460,000 | 5.43% | $350,000 | $300,000 | 61.67% |
| Tulare County | $380,000 | $375,000 | 1.33% | $255,250 | $230,000 | 65.22% |
| Ventura County | $972,000 | $930,000 | 4.52% | $681,250 | $575,000 | 69.04% |
| Yolo County | $610,000 | $620,000 | -1.61% | $443,000 | $447,500 | 36.31% |
| Yuba County | $438,400 | $445,000 | -1.48% | $320,000 | $298,250 | 46.99% |
| Stats courtesy of CAR. | ||||||
See more on the Los Angeles housing report, San Francisco housing market report, San Diego housing market report and the Sacramento housing report.
View more forecasts on the real estate housing market |, and the latest home prices and sales trends for numerous major metros in California including San Diego, Los Angeles, San Francisco, and Sacramento.