US New Home Construction, Prices and Sales
It’s not a reach to say that buying a new home is tops on many American’s wish list. Although demand for new homes is intense, a lack of supply is dampening those dreams of home ownership.
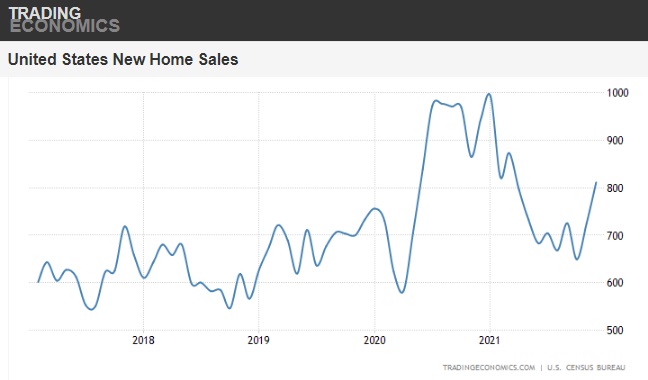
New US home sales rose 4% across the country in October and new home construction kept pace vs September. The promise of growing production in 2022/2023 is drawing the eyes of investors. Home construction stocks are trending upward.
New Home Shortages – 5 Million
However, it seems the home shortage is worsening, and estimates have it that we could be facing a slowdown in construction in 2022. That remains to be seen, however the US market will be severely in short supply.
“Despite the extraordinary efforts of our trade partners, the supply chain issues that have plagued the industry throughout the pandemic have increased during the second half of the year. We continue to work closely with our suppliers, but shortages for a variety of building products, combined with increased production volumes across the homebuilding industry, are directly impacting our ability to get homes closed.” -Pulte CEO Ryan Marshall.
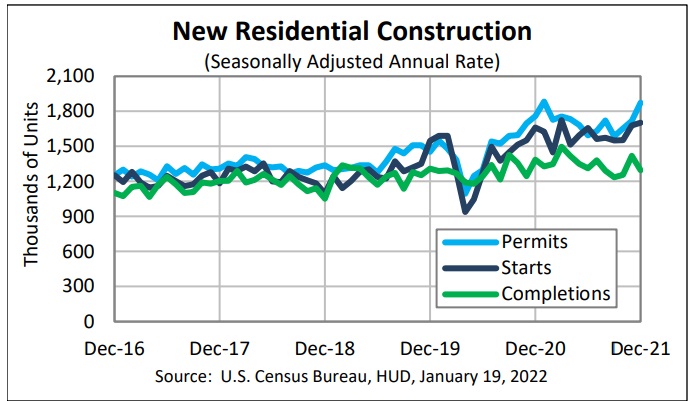
During 2021, 1,724,700 house construction permits were issued, ups 17.2% from 2020’s total of 1,471,100. And an estimated 1,337,800 new dwellings were completed in 2021, up 5% from 2020’s figure of 1,286,900. Housing units completed in 2021 reached an estimated 1,337,800 which was up 4% from 2020’s figure of 1,286,900 units. Construction spending growth slowed to .2% in December.
Real Estate Marketing Packages: Realtors, are you looking to successfully launch your digital marketing campaign for the new season? See the real estate marketing package page for comprehensive service to help you excel online.
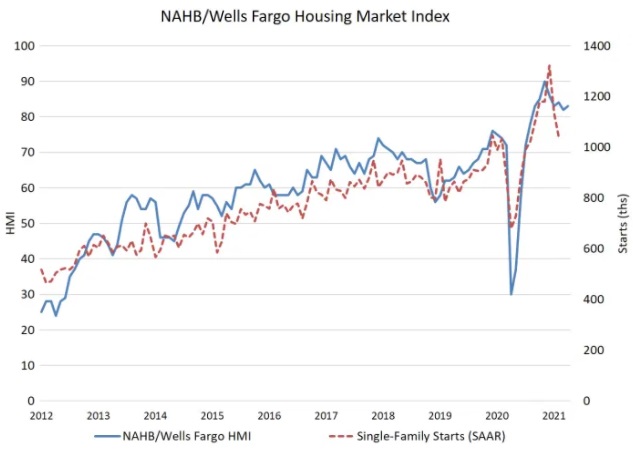
The NAHB homebuilder sentiment fell by 1 point to 83 in January of 2022 from a 10-month high of 84 in December. This is shy of a forecasts of 84. The 6 month home sales sub-index fell to 83 from an upwardly revised 85.
US Cities with Most Construction
Florida, Texas and Arizona are the hot zones for single house construction.
| CSA | CBSA | Metro Region | Total Authorized Starts | 1 Unit | 2 Units | 3 and 4 Units | 5 Units or More |
| 428 | 37980 | Philadelphia-Camden-Wilmington, PA-NJ-DE-MD | 11888 | 1153 | 178 | 300 | 10257 |
| 288 | 26420 | Houston-The Woodlands-Sugar Land, TX | 6885 | 4067 | 64 | 0 | 2754 |
| 408 | 35620 | New York-Newark-Jersey City, NY-NJ-PA | 6145 | 1217 | 124 | 123 | 4681 |
| 429 | 38060 | Phoenix-Mesa-Chandler, AZ | 4918 | 2603 | 98 | 58 | 2159 |
| 999 | 12420 | Austin-Round Rock-Georgetown, TX | 4716 | 2101 | 54 | 58 | 2503 |
| 206 | 19100 | Dallas-Fort Worth-Arlington, TX | 4304 | 3323 | 44 | 116 | 821 |
| 370 | 33100 | Miami-Fort Lauderdale-Pompano Beach, FL | 3520 | 598 | 38 | 47 | 2837 |
| 216 | 19740 | Denver-Aurora-Lakewood, CO | 3480 | 1061 | 62 | 26 | 2331 |
| 122 | 12060 | Atlanta-Sandy Springs-Alpharetta, GA | 3460 | 2190 | 6 | 13 | 1251 |
| 500 | 42660 | Seattle-Tacoma-Bellevue, WA | 3124 | 678 | 54 | 42 | 2350 |
| 400 | 34980 | Nashville-Davidson–Murfreesboro–Franklin, TN | 3120 | 1247 | 2 | 8 | 1863 |
| 348 | 31080 | Los Angeles-Long Beach-Anaheim, CA | 2474 | 785 | 102 | 37 | 1550 |
| 148 | 14460 | Boston-Cambridge-Newton, MA-NH | 2462 | 420 | 48 | 34 | 1960 |
| 548 | 47900 | Washington-Arlington-Alexandria, DC-VA-MD-WV | 2372 | 951 | 2 | 4 | 1415 |
| 378 | 33460 | Minneapolis-St. Paul-Bloomington, MN-WI | 2256 | 918 | 24 | 7 | 1307 |
| 999 | 45300 | Tampa-St. Petersburg-Clearwater, FL | 1978 | 1350 | 4 | 0 | 624 |
| 172 | 16740 | Charlotte-Concord-Gastonia, NC-SC | 1789 | 1336 | 6 | 3 | 444 |
| 412 | 35840 | North Port-Sarasota-Bradenton, FL | 1768 | 938 | 30 | 4 | 796 |
| 422 | 36740 | Orlando-Kissimmee-Sanford, FL | 1667 | 1457 | 4 | 32 | 174 |
| 300 | 27260 | Jacksonville, FL | 1611 | 1531 | 8 | 0 | 72 |
| 488 | 41860 | San Francisco-Oakland-Berkeley, CA | 1592 | 274 | 16 | 18 | 1284 |
| 294 | 26900 | Indianapolis-Carmel-Anderson, IN | 1516 | 790 | 20 | 4 | 702 |
| 348 | 40140 | Riverside-San Bernardino-Ontario, CA | 1337 | 829 | 18 | 42 | 448 |
| 472 | 40900 | Sacramento-Roseville-Folsom, CA | 1235 | 675 | 6 | 0 | 554 |
| 332 | 29820 | Las Vegas-Henderson-Paradise, NV | 1211 | 1131 | 10 | 40 | 30 |
| 484 | 41700 | San Antonio-New Braunfels, TX | 1121 | 789 | 16 | 0 | 316 |
| 450 | 39580 | Raleigh-Cary, NC | 1114 | 972 | 0 | 0 | 142 |
| 357 | 31540 | Madison, WI | 1092 | 138 | 12 | 0 | 942 |
| 482 | 41620 | Salt Lake City, UT | 1035 | 440 | 8 | 19 | 568 |
| 999 | 41740 | San Diego-Chula Vista-Carlsbad, CA | 1034 | 255 | 12 | 30 | 737 |
| 147 | 14260 | Boise City, ID | 1026 | 649 | 10 | 15 | 352 |
| 198 | 18140 | Columbus, OH | 1022 | 439 | 4 | 18 | 561 |
| 476 | 41180 | St. Louis, MO-IL | 1019 | 465 | 26 | 0 | 528 |
| 312 | 28140 | Kansas City, MO-KS | 1010 | 656 | 34 | 35 | 285 |
| 163 | 15980 | Cape Coral-Fort Myers, FL | 1003 | 707 | 72 | 0 | 224 |
| 440 | 38900 | Portland-Vancouver-Hillsboro, OR-WA | 961 | 516 | 4 | 13 | 428 |
| 176 | 16980 | Chicago-Naperville-Elgin, IL-IN-WI | 935 | 634 | 22 | 54 | 225 |
| 482 | 39340 | Provo-Orem, UT | 888 | 593 | 2 | 38 | 255 |
New home starts and completions are important elements of the housing market forecast. They’re growing slowly but not enough to fulfill demand. It shows us where supply and prices are really headed. Homebuilder sentiment however rose to 83 and current sales conditions rose 3 points to 89 according to NAHB. They report a 3% increase in new home buyer traffic. Sales expectations for the next 6 months remained the same.
Year over year, new homes sales have plummeted by 23%. However, sales of new construction homes rose 11% month to month from September to October in the Midwest and were up 0.2% in the Southern US region. In the Northeast and West sales dropped 11.8% and 1.1% respectively.
If higher interest rates are avoided, we might see the residential home construction market improve in 2022. Growth from 2021 to now has been positive, even with supply chain and labor shortages. Those issues with high land prices, limited land to develop, plus government regulations will hamper new home availability in 2026 and beyond. That pushes prices up.
“Lot availability is at multi-decade lows and the construction industry currently has more than 330,000 open positions,” said NAHB Chief Economist Robert Dietz. He is calling on politicians to resolve the severe shortage of lots, however these cries have been sounding for a long time now with no action.
Prices are rising and housing supply continues as the biggest factor in real estate. The fact is, government attempts to suppress demand don’t work and instead create unnatural pressures that can lead to market sell-offs.
You’re intrigued about the possibility of owning a new home. And like many others you might be wondering if resale house prices are going to fall? Resale and new home prices likely aren’t going to fall and a housing market crash is not likely to happen. There’s too many positives supporting the economy and housing.
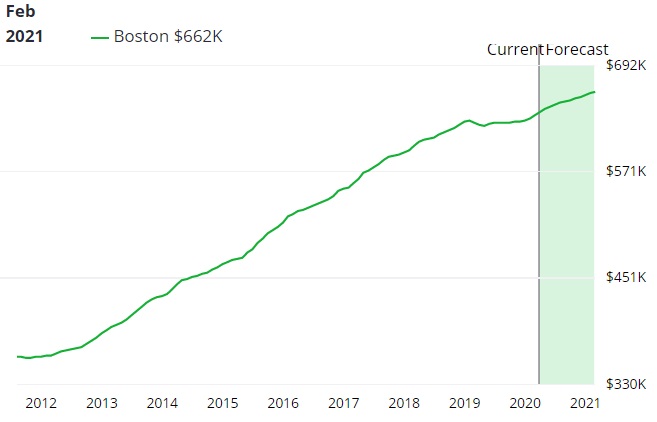
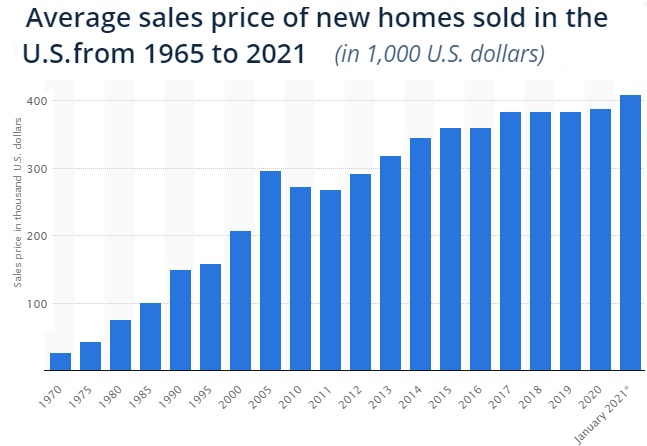
New Home Prices Rising
| 2021 | Median Price (USD) | Homes for Sale |
| January | 373,200.00 | 300,000 |
| February | 362,000.00 | 303,000 |
| March | 359,600.00 | 305,000 |
| April | 376,600.00 | 315,000 |
| May | 390,400.00 | 327,000 |
| June | 374,700.00 | 350,000 |
| July | 406,000.00 | 365,000 |
| August | 407,600.00 | 382,000 |
| September | 404,700.00 | 383,000 |
| October | 407,700.00 |

US New Home Building Permits
Building permits for private residential homes rose 9.1% in December to 1,873,000 from 1,717,000 in November. This was 6.5 percent more than December 2020’s rate of 1,758,000. Single‐family permits in December rose 2% to 1,128,000 from the revised November volume of 1,106,000. Permits for buildings with 5+ units rose 17.2% to 675,000 units in December.
US Housing Starts in December
Privately‐owned housing starts in December rose 1.4% to a new annual rate of 1,702,000 units, from Novembers estimate of 1,678,000. That was up 2.5% more than 12 months ago. Single‐family housing starts in December rose 2.3% to 1,172,000 from November’s 1,199,000 houses. The December rate for units in buildings with five units or more was 524,000.
US Housing Completions in December
Privately‐owned housing completions fell 8.7% in December to an adjusted annual rate of 1,295,000 from November’s estimate of 1,418,000. This number is down 6.6% from the 1,386,000 completions 12 months ago. Completion of single‐family homes in December rose 3.9% to a new rate of 990,000 units from the November rate of 953,000. In multifamily buildings above 5 units, there were 299,000 unit built.
Most mid-income buyers have plenty of savings to put on a new house. That fact means home builders are jumping into the construction with a lot of zeal this year.
New Residential Construction Stats for October
Census.gov released stats for new residential home construction.
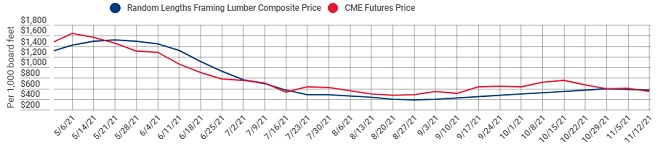
Lumber Costs
NAHB cites lumber prices as having flattened out. Of course, availability is another issue during the supply chain problems and shipping within the US. They say there is a substantial shortager of carpenters.
Builder Optimism is High
The US Commerce Department says builder optimism is high and with low interest rates and big preference for buyers, there’s little to stop significant sales in August and September. The only drawbacks are regulation and high lumber prices. With buyers finding houses for sale scarce, the new home market is vital to the health of the real estate market.
New Home Construction Forecast
NAHB offers their free new home construction forecast to 2023.
|
Housing and Interest Rate Forecast, 04/06/2021
|
|||||||
| 2017 | 2018 | 2019 | 2020 | 2021 | 2022 | 2023 | |
| Housing Activity in thousands | |||||||
| Total Housing Starts | 1,207 | 1,248 | 1,295 | 1,395 | 1,431 | 1,464 | 1,501 |
| Single Family | 851 | 872 | 893 | 1,000 | 1,058 | 1,081 | 1,108 |
| Multifamily | 356 | 376 | 403 | 396 | 374 | 383 | 394 |
| New Single Family Sales | 616 | 614 | 685 | 823 | 874 | 897 | 919 |
| Existing Single-Family Home Sales | 4,904 | 4,737 | 4,749 | 5,076 | 5,777 | 5,815 | 5,921 |
| Interest Rates | |||||||
| Federal Funds Rate | 1.38% | 2.38% | 1.38% | 0.13% | 0.07% | 0.08% | 0.26% |
| Treasury Yield: | |||||||
| Ten Year Maturity | 2.33% | 2.91% | 2.14% | 0.89% | 1.74% | 2.21% | 2.47% |
|
Freddie Mac Commitment Rate:
|
|||||||
| Fixed Rate Mortgages | 3.99% | 4.54% | 3.94% | 3.11% | 3.41% | 3.91% | 4.17% |
| Prime Rate | 4.10% | 4.90% | 5.28% | 3.54% | 3.55% | 3.99% | 4.43% |
Wondering who makes and sells new homes in the US? Check out these companies and if you’re a stock market investor, review the stock prices of publicly listed home builders.
New Residential Home Sales
NAHB’s Robert Dietz reported home builders using pricing incentives in April, but have since reduced those incentives as sales have picked up.
See the latest mortgage rate forecast, economic forecast, and why home prices will rise.
See the latest on the 2026 housing market predictions