
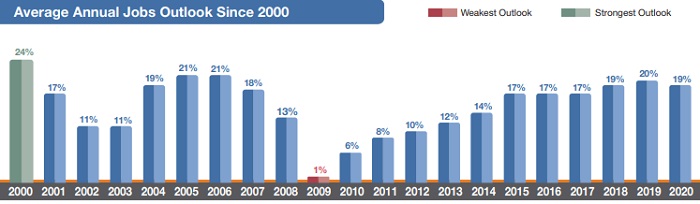
US Jobs Outlook
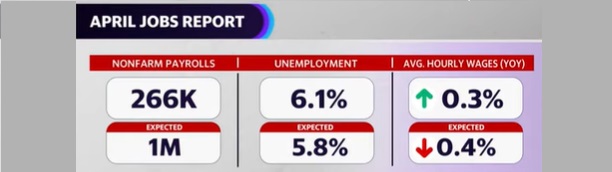
The bungling of the recent jobs report is a sign of trouble with the current government and a sign the job market is troubled. The current report showed only 266,000 jobs created when almost 1 million were expected. This is a disaster.
There are some job market and economic hurdles to deal with and how they’re being managed now has sent the stock market into correction territory. Still the trajectory for employment and stock prices is upward.
This coming fall and holiday season still looks very good and with inflation and business reformation at torrid pace, job growth throughout 2021 and into 2022 should be strong.
The April United States Jobs Report Details
Total nonfarm payroll employment increased by 266,000 in April, following increases of 770,000 in March and 536,000 in February. In April, nonfarm employment is down by 8.2 million, or 5.4%, from its pre-pandemic level in February 2020. average hourly earnings for all nonfarm private workers grew by 21 cents to $30.17.
In April, employment in leisure and hospitality jumped a strong 331,000, as the restaurants, tourism, travel, hotels an bars began opening again. Although leisure and hospitality has added 5.4 million jobs over the year, employment in the industry has declined by 16.8% or by 2.8 million jobs since February 2020.
Service industry jobs grew by 44,000 with gains in repair and maintenance (+14,000) and personal and laundry services (+14,000).
Jobs in employment in local government education rose 31,000 in April but is still down 611,000 compared to 14 months ago pre-pandemic. Federal government jobs were boosted up by 9,000.
Employment in social assistance departments rose by 23,000, with about half of the increase in child day care services (+12,000) this is still down by 286,000 compared to pre-pandemic.
Employment in financial services sector rose by 19,000 over the month, primarily in real estate and rental and leasing (+17,000). Employment in financial activities is down by 63,000 since February 2020.
Professional and business services jobs declined by 111,000 in April and is 296,000 lower than pre-pandemic.
Transportation and warehousing jobs fell by 77,000 in April yet this sector is 126,000 jobs since pre-pandemic period.
Manufacturing jobs lost 18,000 positions in April after it had solid gains in previous months. f In April, job losses in the auto sector fell by 27,000. Durable goods manufacturing jobs grew by +13,000 and chemicals (+4,000). Employment in manufacturing is still down an astonishing 515,000 jobs than pre-pandemic months.
This jobs report does not support a healthy economic growth nor give stock market investors a boost of confidence. In turn, it could cause companies to hire less slowly this summer.
Jobs market out of whack and companies can’t find workers willing to work.
More Positive is the March Jobs report
Let look back at March’s strong job report before April’s nasty surprise.
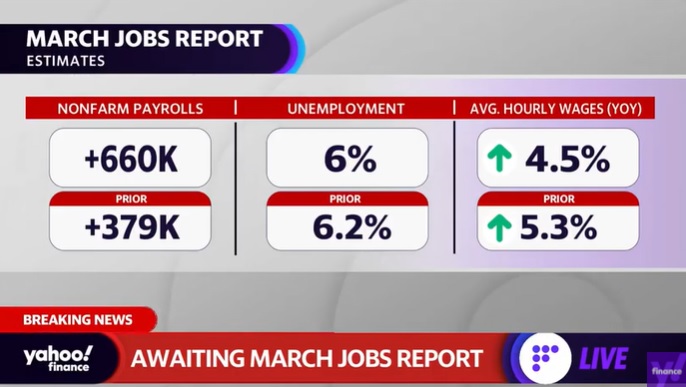
- non-farm payrolls: +916,000 vs +468,000 in February
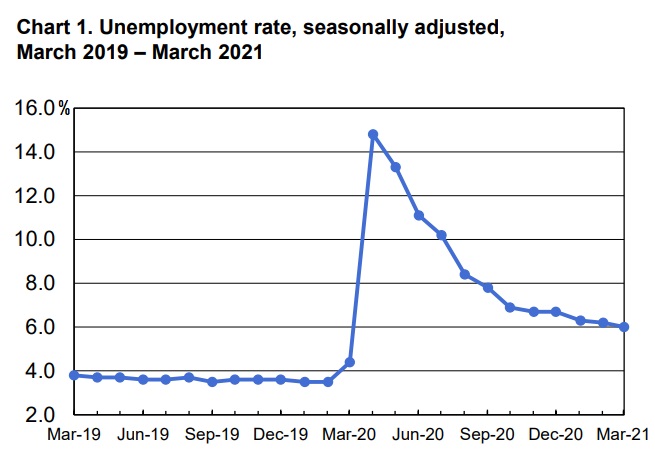
- unemployment rate: 6.0% vs +6.2% in February
- average hourly earnings down 0.1% (falling 4 cents to $29.96) vs a rise of 0.3% in February
- average hourly earnings grew 4.2% YoY while +4.5% increase was expected (+5.2% in February)
- number of persons on temporary layoff declined by 203,000 in March to 2.0 million
- long-term unemployed (those jobless for 27 weeks or more), at 4.2 million, changed
little over the month but is up by 3.1 million since February 2020 - 21.0% of employed persons teleworked because of the coronavirus pandemic, down
from 22.7% in the prior month - leisure and hospitality payrolls grew by 280,000 in March (revised gain of 384,000 in February)
- construction jobs increased 110,000 after a decline of 56,000 a month earlier
- 3.7 million persons were prevented from looking for work due to the pandemic (others weren’t counted because they weren’t actively looking for work)
- education jobs surged by 190,000
- employment in professional and business services rose by 66,000 but still down 680,000 from pre-pandemic levels
- manufacturing employment gained 53,000 in March
- retail trade added 23,000 jobs and wholesale trade jobs rose by 24,000
- Hawaii and New York had the highest unemployment rates in March, 9.0% and 8.5%
- Nebraska, South Dakota, Utah, and Vermont had the lowest rates, 2.9% each
The BLS latest jobs report is giving credence to a strong stock market outlook and little support for any type of correction or crash.
The stock markets responded well to the jobs news and to the growth in consumer spending.
High Level View: positive job numbers show the workplace is reviving and a rising tide will lift all ships including stock prices, housing prices, small business survival rates, consumer spending, and provide some relief from the Corona Virus devastation.
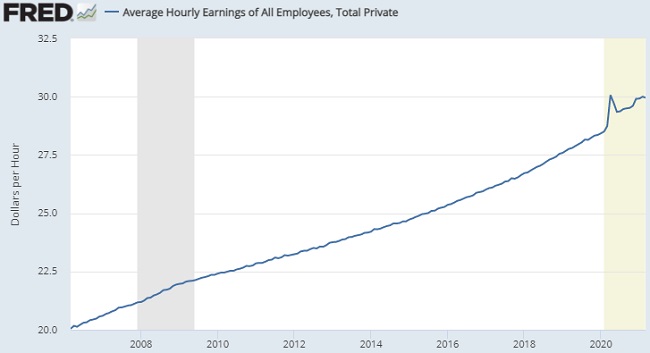
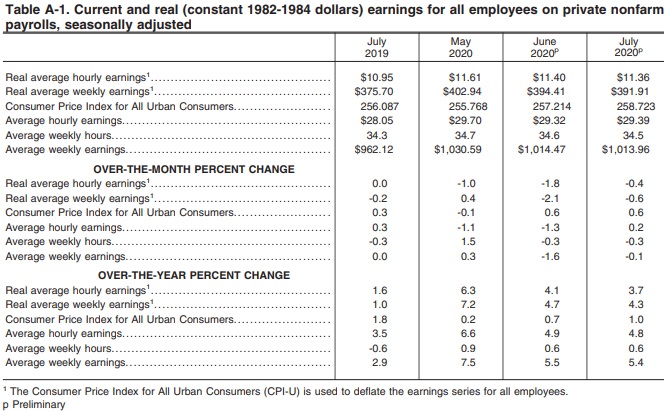
Excellent News for US Workers: Wages Rising
The outlook for wage levels in the US is on an upward tangent. In July, average hourly earnings for all employees on private nonfarm payrolls rose by 7 cents to $29.39 an hour.
As we know, the stock market indexes reflect the fortunes of large corporations such as IBM, Microsoft, Google, Facebook, Oracle, GM, Ford, and Amazon rather than small business.
Top Paying Jobs. Screenshot courtesy of BLSHousing prices will return and credit worthiness will improve. Will mortgage numbers grow? Certainly applications for mortgages are returning.
As the state’s and federal workplace shutdown eases the job numbers for June, July and August will likely be even better. Of course, reports on Covid 19 breakouts, second waves, stimulus money, and trade data will be influential on future job forecasts.
Return of construction jobs is particularly important to the housing market. Housing market predictions were increasingly glum throughout the last 3 months.
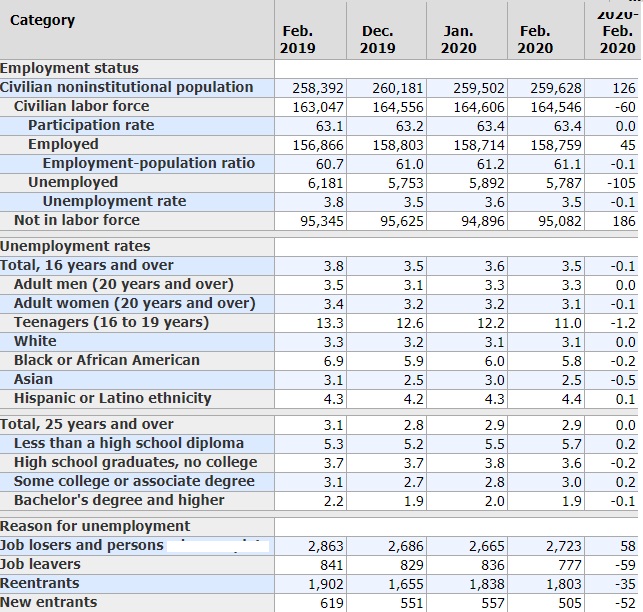
February US Jobs Report. Screenshot courtesy of BLS.govWe have to keep in mind that the same upward revision might happen to December’s figures. The BLS figures for December are not out yet.
US Employment Outlook
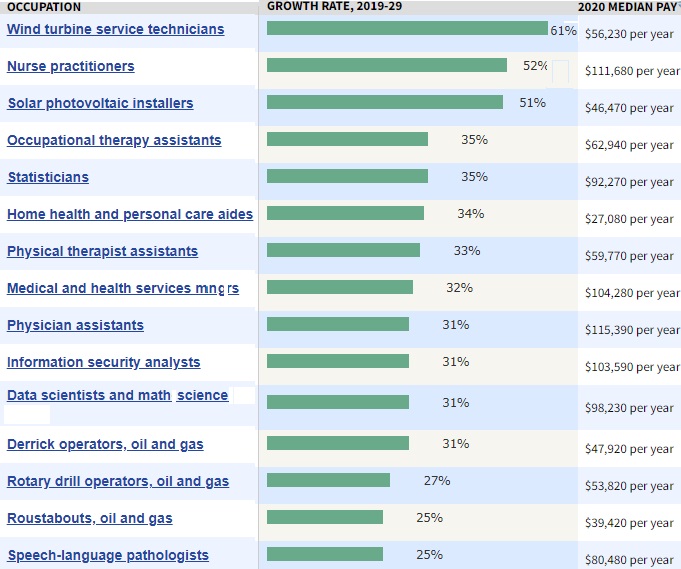
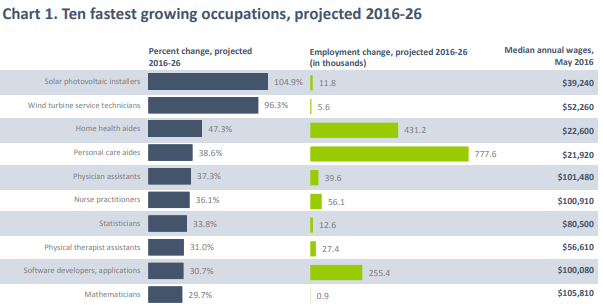
BLS has presented its forecast of the US employment picture for the 2019–2029 period. The pandemic cut into the forecast over the last 12 months, unexpectedly. However, it looks like by late summer or August/September, this forecast should come back to be fairly accurate.
BLS projected a growth of employment from 162.8 million to 168.8 million over the 2019–29
decade, rise of 6.0 million jobs, the U.S. Bureau of Labor Statistics reported
today. This reflects an annual growth rate of 0.4 percent. Healthcare and social assistance sector was projected to add the most new jobs, and 6 of the 10 fastest growing occupations are related to healthcare.
Growth in real Gross Domestic Product (GDP) was projected to be slower (1.8% annually) from 2019 to 2029, compared to the previous decade (2.3 percent annually). Of course this prediction is suspiciously pessimistic making us wonder about why it’s so off base. In fact, GDP is rising extremely fast and is predicted to soar. The error might have arisen from a projected collapse of government spending, while the reverse has actually happened.
They forecast labor productivity to grow 1.1% annually over the 2009 to 2019 period, to 1.8% from 2019 to 2029.
With trade and economic news favoring the US economy, the 2020 job forecast might be better than even experts forecast. The stock market is a believer and the housing market 2020 is seeing upward pressure on sales and higher home prices.
Highlights of the ADP Report (Last Year)
Private-sector employment increased by 167,000 from last June to July, on a seasonally adjusted basis.
- private sector jobs rose 167,000
- goods production jobs up 1000
- mid sized companies lost 25000 jobs
- small companies added 63000 jobs
- large enterprises added 129000 jobs
- trade transportation jobs up 41000
- real estate jobs up 8,000
- financial jobs added 26,000
- construction jobs fell 8,000
- manufacturing jobs up 10000
- professional and business jobs up 58,000
- education and health up 46,000
- leisure and hospitality down 38,000
The growth for SMBs is especially positive as that fuels even more growth in the overall economy.
New US Plants Might be Popping up More Often
The coming trade war with China should encourage the building and repatriation of huge numbers of manufacturing plants in very lucrative industries.
If industry has been good for China, it will be especially good for the US.
It seems skittish corporate business owners are cheating themselves out of a strong economy. Despite their pessimism over International trade, US consumption is excellent. Fears of a recession are diminishing even with the Iran conflict in full bloom.
2020 was supposed to be the year of the recession according to experts and economists, but the 2021 housing market forecast, job market, and stock market outlook look promising.
Does anyone remember 2009?
2021 Brings More Optimism for the Job Hunt
Wages: Average hourly wages grew again by 7 cents to $28.29 an hour. Over the last 12 months, average hourly earnings have risen 3.7%. Average weekly earnings have risen 5.4% since last July.
Recent stock market volatility is no reflection of this booming US economy. The government shut down will certain lower January’s rates, but as spring approaches, with the import tariffs intact, employment and wages should rise again. Which states/cities should benefit most? Florida, Atlanta, San Francisco, Tampa, Phoenix, Indianapolis, Boston, Milwaukee,
Although multinationals are balking at repatriating jobs from overseas the picture is excellent for US-based companies. Investment in US stocks will be strong this year whereas Faang stocks may falter.

Labor unrest seems to have eased as wages are beginning to climb and the jobless rate is falling. With the end of the Corona Virus by spring of 2021, unemployment should plummet as personal service, entertainment, leisure and travel jobs return in full force.
One US economist forecasted that labor markets will tighten and wage growth will accelerate. 2020 will be good times for American workers. Offshore workers too will likely see upward growth as the US pulls up their wages.
When the economy gains momentum, wages rise, and optimism grows. we’ll like see the additional effects of a resurgent home prices and the effects of investment in housing. The forecast was for a much slower end to 2019, but even with stock market volatility and flat housing prices, these job numbers reflect the good times are rolling right into 2020.
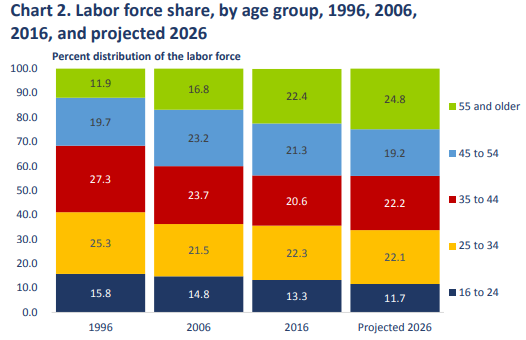
Demand for young workers and professionals will be high. Employment is increasingly dominated by older workers as we approach 2026, and yet a smaller pool of young workers will be available. That is good news for older workers too, but as baby boomers retire, competent young replacements will be needed and wanted by corporations.
Jobs Forecasts and Data
The Covid 19 disease from China has devastated the US and its made long term economic forecasts, housing forecasts and stock market forecasts difficult. Experts are focusing on 3 months at a time right now.
Will Florida, California, Texas have the job opportunities once Covid 19 runs its course? The charts, videos and commentary below show the best cities and employment/jobs sectors with the most promise. California will certainly lead in jobs produced from artificial intelligence. Programmers in AI will write their own checks.
From manufacturing to transportation and infrastructure development to energy to retail trade, 2020 looks like a rare opportunity for US workers to move, land a good paying job, grow their skills, experience, enjoyment, or buy a home, travel, and invest.
“Today, the ratio of unemployed Americans to open jobs stands at 1.4 to 1, down sharply from 6.6 to 1 during the last recession in July 2009. That shrinking pool of job seekers translates into fewer available candidates — leading to today’s growing reliance on recruiting from passive, already employed candidates.” – from Andrew Chamberlain, chief economist at Glassdoor.com
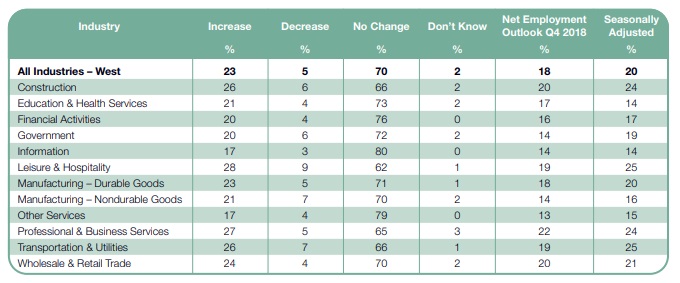
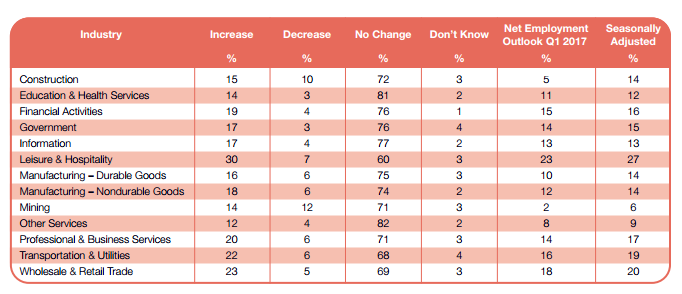
Professional and business services looking strong in Alaska, Arizona, California, Colorado, Hawaii, Idaho, Montana, Nevada, New Mexico, Oregon, Utah, Washington, Wyoming. Wages gains will be strongest in: Leisure & Hospitality (28%), Professional & Business Services, (25%), Transportation & Utilities (24%), Mining (22%), Wholesale & Retail Trade (22%), Durable Goods Manufacturing (19%), and Construction (18%),
California Jobs by Sector
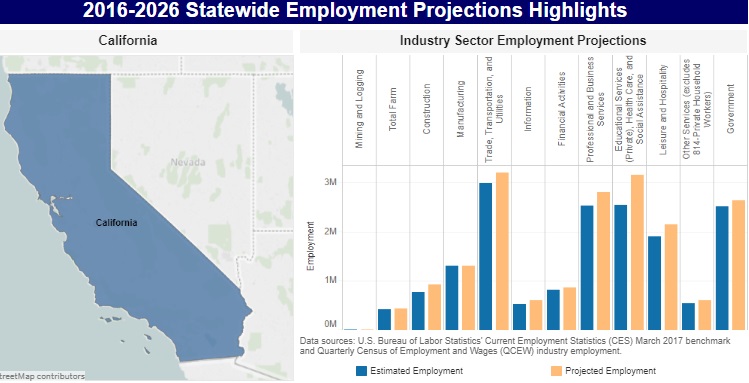
Love those California wages, but not so much the California housing market.
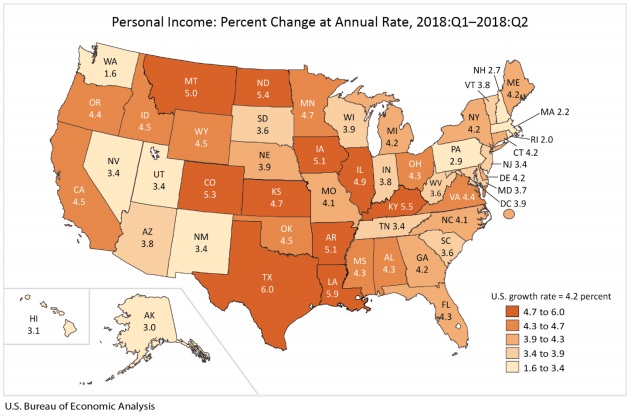
Average Income by State
Growth in average income by state was a hot 5.0% in the 1st quarter of 2018, and still good at 4.2% in the 2nd quarter.
Will Fair Trade Create a Better Outlook for the US Worker?
What we learned from the free trade era is that good jobs inevitably leave to be near where products are designed and manufactured, especially if it’s cheap. Corporations are cutthroat when it comes to profit and tax reduction.
And today, investment funds flows in a millisecond, away from taxation to the cheapest labor markets. US investment dollars were building jobs in other countries. What was left are skeletal retail sales and warehouse distribution jobs — few, part-time, and poor paying — the kind you already know all too well and which are being automated.
Canada and the UK have suffered equally with Free Trade however, will Fair Trade deliver sustained employment between honest trade partners?
The new post-Obama era holds a lot of promise for Millennials and Gen Z’s who are sadly mired in personal and student loan debt and only have a vague dream of ever buying a home. For babyboomers, this last kick at the can might be a very good kick!
The fact the US has performed as well as it has, shows this country’s creativity and resilience through the past 30 years. But this is a momentous time where very high quality jobs and business investment money will return to the US. Those who are skilled and experienced should be in exceptionally high demand and incomes will definitely rise. It’s good to be skilled and in demand!
Fresh Updated Forecast from Manpower Group
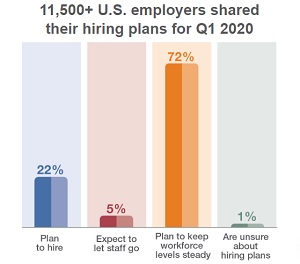
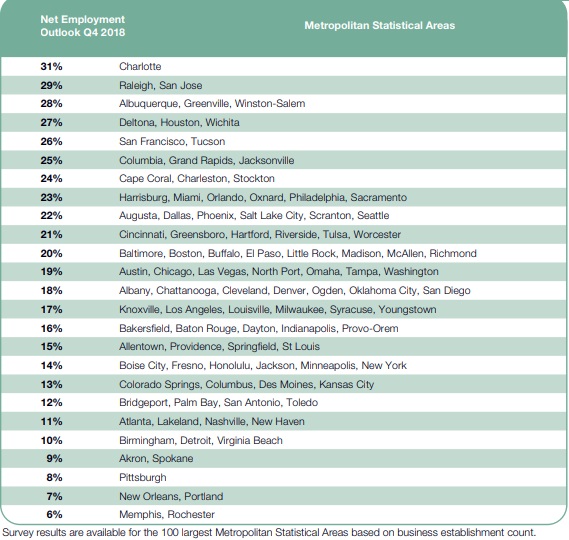
According to the new study and report by ManpowerGroup, a major information provider for employment forecasts, predictions and outlooks. Manpower Group surveyed more than 11,000 employers to learn more about their attitudes, needs and forecasts for hiring for 4th quarter 2018.
From the ManPowerGroup report, here are the cities with the best job forecast outlook:
Best Employment Sectors: Manufacturing, Wholesale & Retail Trade, Transportation & Utilities

The ManpowerGroup report doesn’t touch much on the Oil & Gas industry which could significant growth. Oil prices are rising slightly to under $60 a barrel for the next 2 years. With a rising USD dollar, US energy exports could be very lucrative. Will North Dakota see a jobs boom?
According to the US energy jobs report,
“Energy Efficiency employers project the highest growth rate over the next 12 months (9%), followed by Electric Power Generation (7%); Transmission, Distribution, and Storage (6%), and Motor Vehicles (3%).
The report suggests manufacturing in the energy sector will be low growth, but will Trump’s intentions change that?
The Best and Worst Cities for Jobs in the US
WalletHub has released its survey of US employers and generated a rating system of best cities for jobs. WalletHub’s analysts assessed 150 of the most populated U.S. cities across 23 key indicators of job-market strength. Criteria for job outlook rankings included: job opportunities, employment growth, median annual income and more. You can see the full list at Wallethub.com.
Where will you find a job this year? Here’s the latest employment outlook in the US:
| Rank | City | Total Score | ‘Job Market’ Rank | Socio economic Rank |
| 1 | Scottsdale, AZ | 70.48 | 1 | 2 |
| 2 | Plano, TX | 64.91 | 4 | 13 |
| 3 | Orlando, FL | 64.9 | 2 | 19 |
| 4 | Sioux Falls, SD | 64.72 | 5 | 11 |
| 5 | San Francisco, CA | 63.37 | 6 | 34 |
| 6 | Rancho Cucamonga, CA | 63.35 | 7 | 15 |
| 7 | Chandler, AZ | 62.71 | 16 | 8 |
| 8 | Salt Lake City, UT | 62.54 | 10 | 25 |
| 9 | Tempe, AZ | 62.17 | 15 | 12 |
| 10 | Raleigh, NC | 61.29 | 13 | 40 |
| 11 | Peoria, AZ | 61.26 | 14 | 37 |
| 12 | Miami, FL | 60.78 | 3 | 126 |
| 13 | Honolulu, HI | 60.49 | 18 | 33 |
| 14 | Fort Lauderdale, FL | 60.23 | 12 | 79 |
| 15 | Fort Wayne, IN | 60.15 | 8 | 73 |
| 16 | Minneapolis, MN | 60.11 | 31 | 6 |
| 17 | Garland, TX | 59.74 | 11 | 93 |
| 18 | Gilbert, AZ | 59.59 | 27 | 17 |
| 19 | Overland Park, KS | 59.58 | 34 | 5 |
| 20 | San Jose, CA | 59.41 | 22 | 38 |
| 21 | Dallas, TX | 59.36 | 9 | 117 |
| 22 | Austin, TX | 59.33 | 26 | 26 |
| 23 | Washington, DC | 59.09 | 20 | 61 |
| 24 | Irvine, CA | 58.72 | 49 | 3 |
| 25 | Atlanta, GA | 58.62 | 25 | 45 |
| 26 | Grand Prairie, TX | 58.59 | 23 | 55 |
| 27 | Omaha, NE | 58.47 | 35 | 16 |
| 28 | Little Rock, AR | 58.41 | 17 | 103 |
| 29 | Boise, ID | 58.12 | 52 | 4 |
| 30 | Huntington Beach, CA | 57.95 | 37 | 20 |
| 31 | Nashville, TN | 57.92 | 19 | 105 |
| 32 | Ontario, CA | 57.86 | 21 | 94 |
| 33 | Lincoln, NE | 57.76 | 58 | 9 |
| 34 | Amarillo, TX | 57.51 | 29 | 60 |
| 35 | Denver, CO | 57.23 | 42 | 22 |
| 36 | Pittsburgh, PA | 57.09 | 63 | 7 |
| 37 | Irving, TX | 57 | 24 | 102 |
| 38 | San Diego, CA | 56.98 | 48 | 21 |
| 39 | Colorado Springs, CO | 56.95 | 43 | 28 |
| 40 | Tulsa, OK | 56.94 | 28 | 84 |
| 41 | Cincinnati, OH | 56.93 | 36 | 49 |
| 42 | Fremont, CA | 56.81 | 45 | 32 |
| 43 | St. Louis, MO | 56.5 | 32 | 76 |
| 44 | Reno, NV | 56.4 | 38 | 50 |
| 45 | Fontana, CA | 56.18 | 30 | 95 |
| 46 | Madison, WI | 56.13 | 86 | 1 |
| 47 | Glendale, AZ | 55.99 | 33 | 96 |
| 48 | Sacramento, CA | 55.58 | 51 | 41 |
| 49 | Mesa, AZ | 55.54 | 41 | 62 |
| 50 | Lubbock, TX | 55.44 | 50 | 48 |
| 51 | St. Paul, MN | 55.36 | 76 | 14 |
| 52 | Tampa, FL | 55.33 | 66 | 30 |
| 53 | Henderson, NV | 55.29 | 54 | 46 |
| 54 | Boston, MA | 55.22 | 60 | 42 |
| 55 | Phoenix, AZ | 55.17 | 46 | 70 |
| 56 | Vancouver, WA | 55.09 | 68 | 31 |
| 57 | Las Vegas, NV | 54.87 | 62 | 43 |
| 58 | San Antonio, TX | 54.6 | 39 | 107 |
| 59 | St. Petersburg, FL | 54.58 | 61 | 53 |
| 60 | Grand Rapids, MI | 54.51 | 75 | 29 |
| 61 | Durham, NC | 54.31 | 47 | 90 |
| 62 | Anchorage, AK | 54.24 | 65 | 56 |
| 63 | Richmond, VA | 54.12 | 70 | 47 |
| 64 | Charlotte, NC | 54.06 | 55 | 86 |
| 65 | Columbus, OH | 53.93 | 73 | 51 |
| 66 | Riverside, CA | 53.81 | 56 | 97 |
| 67 | Portland, OR | 53.78 | 80 | 36 |
| 68 | Chattanooga, TN | 53.64 | 43 | 125 |
| 69 | Arlington, TX | 53.52 | 57 | 98 |
| 70 | Aurora, CO | 53.49 | 53 | 104 |
| 71 | Jersey City, NJ | 53.29 | 82 | 44 |
| 72 | Pembroke Pines, FL | 53.15 | 74 | 65 |
| 73 | Santa Rosa, CA | 53.02 | 88 | 35 |
| 74 | Virginia Beach, VA | 52.85 | 92 | 18 |
| 75 | Oklahoma City, OK | 52.78 | 72 | 89 |
Conclusion: the US employment picture is brightening, however we won’t see full growth until 2022. US housing market is rocketing and home prices will rise further, and with government meddling, we might see it go into a high speed wobble before it crashes in 2023.
Stock Market Forecast 2023 | California | Best S&P Sectors | Stock Market Crash 2023 |3 Month Stock Market Predictions | 5 Year Stock Forecast | Dow Jones Forecast 2023 | NASDAQ Forecast 2023 | Oil Price | S&P Predictions | Stocks Next Week | 6 Month Outlook | Stock Prediction Software