Watching P/E Ratios Might Help You Pick Winning Stocks
Investors often make snap decisions on stocks to buy, which is why stats show most investors lose when choosing individual stocks.
Disappointment waits when investors swim in murky, unknown waters with no indicators about which direction to go. Today, let’s dig down into one key signal you need to master.
Do we stick with the hot NASDAQ stocks or positive growth S&P stocks or stick with more stable Dow Stocks and wait for the economic recovery? It’s not easy to pick the best performing stocks, and buy and sell at the right times. Investors could be more mindful of key value indicators and tone down the media hype and advertising surrounding stocks that somebody wants to sell.
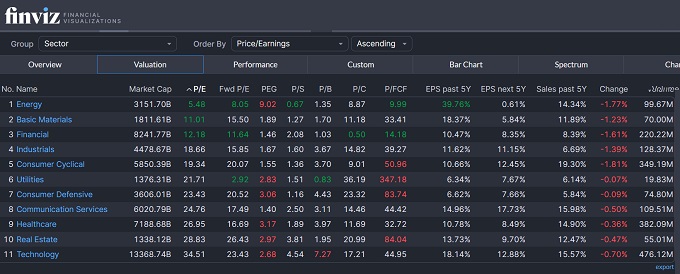
Assessing P/E ratios is a big part of a full assessment of stocks and key in finding the best market sectors in 2024 to invest in.
Investors are vulnerable to biased perspectives, reports and news that is designed to extract their money from them.
Investment Performance Signals
The price to earnings ratio is one of the most important factors investors and analysts to decide on particular stock’s value. It’s a component of fundamental market analysis.
There are other factors you may want to consider before buying stocks, such as earnings forecasts, company debt, dividends paid, how the company’s sector is performing and consumer demand and technology changes as examples.
A stock’s earnings per share and P/E ratio should be compared to similar stocks in that sector for better understanding of its profitability.
Choosing the best stocks to buy is a big challenge and very few analysts do well in predicting stock prices. The best may use a price range to buy in and leave it to fate with a longer time frame.
A P/E o f 10 or less often indicates a stock is very cheap and a good bet to buy if it meets other performance and outlook criteria. A P/E above 30 is not so good, and this is where most stocks are. In fact, during the pandemic stimulus fed stock market boom, P/E ratios soared to unrealistic heights.
The P/E is the actual profit performance of the stock but it doesn’t say how those profits are used or distributed to shareholders.
The P/E ratio is calculated by dividing share price by a companies earnings per share. The formula used is: Current price / earnings per share = P/E ratio.
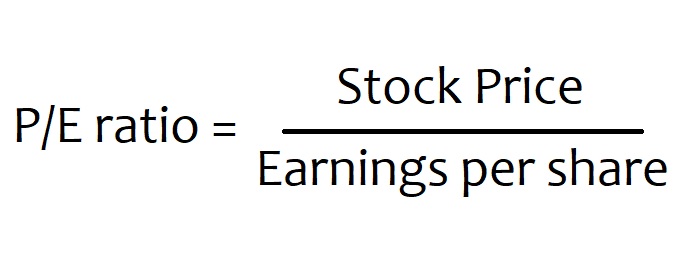
Earnings per share (EPS) is a company’s recorded profit that is paid out to each outstanding share of a company’s common stock. Obtaining the latest per share isn’t usually possible, so what ever is reported last is used.
A too high P/E ratio suggests the stock is overvalued and overbought, while a low P/E ratio signifies it might be bargain to purchase. It’s performing well yet has been underrated by analysts and investors.
Low P/E ratios seem ideal, yet you’ll need to research why investors aren’t buying the stock. It might be due to a number of reasons such as analysts valuations based on info only they know.
Stocks with Low, Low P/E Ratios
Low P/E values aren’t a reliable indicator on their own since the stock could be a dog in many other ways. There is hidden information that can ruin the outlook such as big cash outlays, debts due soon, takeover plans, accounting reporting anomalies, which could throw you a curve ball.
From Dogs of the Dow, a stock investment website, this list shows those Dow Jones stocks with what are appear to be veritable bargains with very ideal P/E ratios. Most are energy companies.
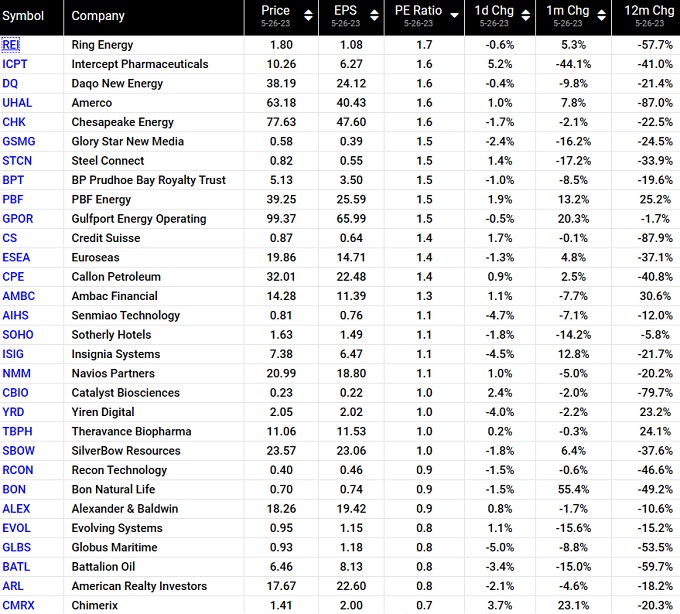
P/E Ratios of Oil Stocks
For instance, oil stocks have very low P/E ratios sometimes as low as 2, which means they could be very profitable with a rising price, good industry forecast (see below), and through dividends distributed due to their strong profits. Investors may feel the oil companies will fare less well due to climate-based restrictions, slowing economy, high inflation, and democrat refusal to invest in carbon based energy companies.
This week oil prices plummeted $5 a barrel due to fears over FED inflation, and stalled US Debt crisis legislation, and consumer pessimism reports. Next month it will be something else meaning threats are always present or there’s a lack of certainty about the oil and gasoline sector.
Oil company P/E ratios are low which means they’re may be a great buy, as long as the long term forecast for oil prices is up. Which it is.
The oil stocks are a good example of how you can capitalize on someone else’s mistakes and fake investing principles. Buying a stock when it’s undervalued just before its industry booms, ensures a massive profit is ahead. Certainly this is the case in the booming AI sector ($4 Trillion surge) where top AI stocks such as Intel, Nvidia, C3.ai Inc., Microsoft (OpenAI ChatGPT), and Tesla lead the price growth bonanza.
Of course, each oil company has its own profiles such as exploration and drilling, current oilfield volumes, production capacity, and cost outlooks. If a company needs to buy oilfields or another oil company to capitalize on its own output, and it has the cash, then a buyout might lift it’s profit outlook greatly.
You have to look at the specifics of the company’s sales, customer base and market strength. Is the product going to be in demand in 2024 and beyond?
So, armed with your P/E ratio info on industry sectors, S&P stocks, Dow Jones Stocks, and NASDAQ stocks, you can weigh in economic outlook data to decide whether that stock has an upward future trajectory.
Nvidia and Tesla are two examples of stocks whose P/E ratios were low, yet boomed because of technology advancements in chips and rechargeable batteries. If you’re looking for big winner stocks and are keen to get big gains in your investment portfolio, then searching for these low P/E ratio companies is the right choice. In many cases, it’s not as risky as it seems.
Of course, Nvidia has been run up by speculators and now the fund managers are dumping the stock, as it’s P/E ratio has risen to 208.46. That’s ridiculously high and obviously overvalued. What’s notable about Tesla is its relentless innovation in products and revenue generation, as well as its competitiveness. Recently they announced price cuts and a 50% vehicle delivery price cut. It’s very difficult for other car makers to keep up. And EVs have longer mileage capabilities and better mileage per dollar than gasoline powered cars. Even during the pandemic, this company solved its supply channel problems and is now making its own batteries and microchips. It fends off threats very well.
Some experts are now saying the AI hype will fade as companies fail to perform profitably.
It is about cyclicality, and Tesla (TSLA) is one vulnerable to economic setbacks and cheap oil prices. It boomed solely because of the Biden regime’s climate protection actions. Without that regulation, sales would plummet and with cheap gasoline, sales would plummet further. Fortunately for Tesla, oil prices and gasoline prices are predicted to rise strongly.
Some experts feel Tesla will go 10X its value within a few years. Trends come and go but is the economy and consumer preference on Tesla’s side. It look like it is. Strangely though, Tesla’s P/E ratio currently stands at 59.22 which is not good by any measure. If you check Tesla’s stock out, you’ll discover that they can earn more revenue through digital services and when Tesla sells 500 million vehicles, that revenue stream will be a torrent.
Earnings Growth
Another factor to weigh in is the company’s earnings growth and P/E ratio changes. Earnings growth trends can indicate momentum that isn’t reflected in the P/E ratio. Having a look at P/E ratios over time and of course the stocks all time lows and highs provide some interesting views.
The PEG Ratio
The Price Earnings Growth ratio measures a company/stock’s current earnings vs the expected growth rate for the company/stock in future. Of course, you have to trust the analyst’s accuracy in forecasting future earnings. Too often, analyst’s views are skewed by business ties, politics and tools that really don’t hit on the real causes of good performance.
The more analyst reports from varying sources you capture, the more accurate your view will be.
P/E ratios remain a key signal for choosing the best stocks. Smart investors take their time in reviewing stocks before purchasing.
If you can find low P/E ratio stocks in a growth sector and pick a company with a solid balance sheet, cash reserves, and it’s PEG rate is growing, you have a pretty good idea of how it’s going to perform in the next 6 month or 5 years.
Being well read in stock market news and watching stocks rise and fall is a big helper in making good investment decisions. Once you experience a loss picking bad stocks or see one happening (Bitcoin) you know to avoid buying them.
It’s very difficult to pick winning stocks. Very often you’ll need to buy stocks in sectors you believe in and understand. Buying stocks with companies in sectors you don’t understand (biomedical, pharma) makes for nervous days and nights. Stick with what you know and can learn.
What you learn is your more vital investing asset. Winning is for those who inform themselves. Please bookmark this and return for up to date stock price forecasts for the stock market in 2024.
Stock Market 2024 | AI Stock Forecasts | XOM Price Forecast | ChatGPT Stock Forecasts 2024 | Best S&P Sectors | Best Stocks to Buy Now | Tesla Stock Forecast 2024 | Stock Price Quote | Stock Market Today | Stock Market Prediction | Stock Market Forecast | Stock Market News | US Housing Market Forecast 2024 | S&P 500 Forecast 2024 | Dow Jones Forecast 2024 | Oil Price Forecast 2024 | Stock Market Today