US Home Prices
Wondering about where home prices are headed? Is now the time to buy, and is selling now wise too? How high could US housing prices reach?
Below we see the price forces and stats from real estate data sources such as NAR, NAHB, FRED, Redfin, Corelogic, Statista, Trading Economics and Reuters. The true picture of housing prices is to the upside, and read on to find out why homes will cost more in 2022 and the next 5 years.
Housing market forecasters are reluctant to offer solid predictions of home prices for the next 5 years or even 6 months. It’s frustrating for home sellers who need to time the sale of their house and make new living arrangements. You can’t sell your home if you have no where to go.
Let’s do a deep dive into the topic of real estate and what’s actually encouraging the ultra-high and rising home price growth. I would be delighted and honored if you shared this epic report via your social accounts. No one else is thoroughly exploring home price directions and sales stats providers are notoriously slow and reluctant to disseminate data to buyers and sellers. Your readers will enjoy it.
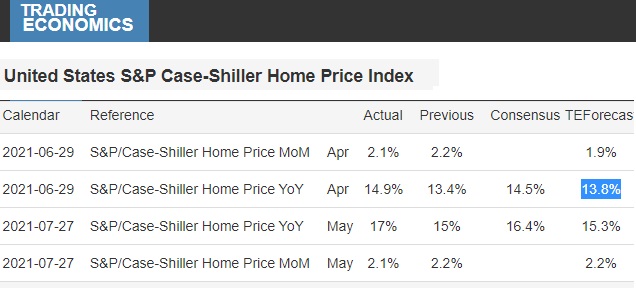
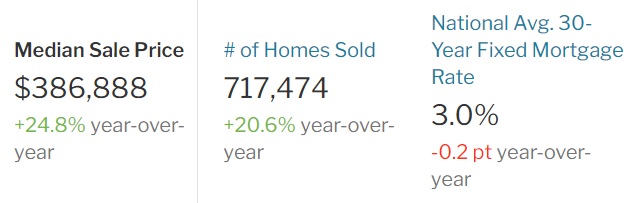
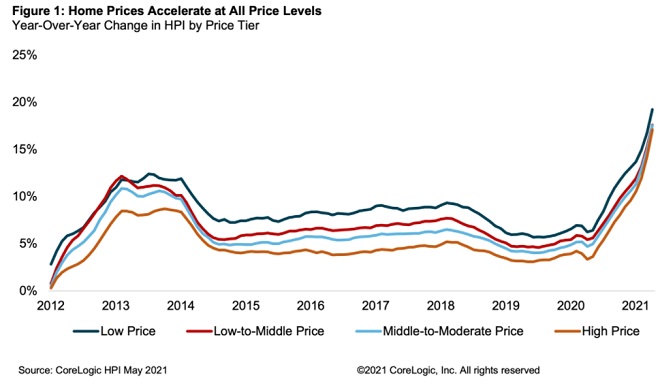
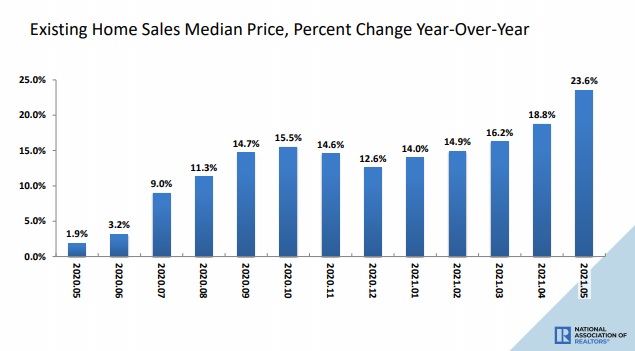
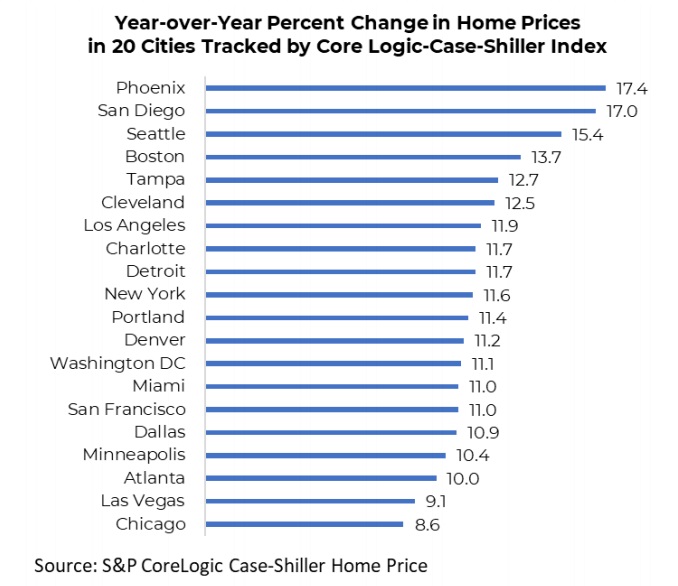
Housing prices across the US tripled in growth compared to last year. According to Redfin, home prices are up 24.8% year over year. Case Shiller forecasts home prices will rise 23.8% year over year for 2022. See more on housing market predictions for 2022 and the next 5 years. Whichever housing price stats you choose to believe (NAR, local, Zillow or Redfin), the price growth rate may be slowing:
No one has come up with a believable home price forecast for 2022 because there are quite a few demand factors that are question marks. These 2022 variables you should watch are interest rate rises, taxes, regulations, inflation, infrastructure spending, political standoffs, 2022 Senate elections, China political and trade actions, stock market volatility, and commodity prices.
If we do enter a period of stagflation as economists are talking about, it means GDP will stagnate and inflation will eat away at incomes, investments, savings, reducing money available for buying homes. More stock market and finance experts believe inflation will become a problem. Currently, it’s at 5.39% which is very high.
Some Housing Experts are Talking Flat Prices
Housing experts and economists are detached from reality. People want houses and their determination and persistence have been evident for two years now just as big stimulus is ready to be injected into a reawakening economy.
Yes, they’re saying demand will weaken since buyers have purchased and are onto the next thing in their life such as travel, new cars, swimming pools, etc. However, we know bidding wars have happened from New York to Los Angeles to Dallas to all areas of Florida. Bidding wars and record home showings means big demand. These buyers haven’t found their home and they’re not going away.
Consider that although many buyers are renting, they don’t want to be. Renting is one step away from homelessness which we know is a big problem. Add 200,000 migrants coming in across the US border every month plus foreign buyers and students returning to the US, and why would demand for homes be written off? Mortgages are very low so it’s a good time to buy if you can find something affordable.
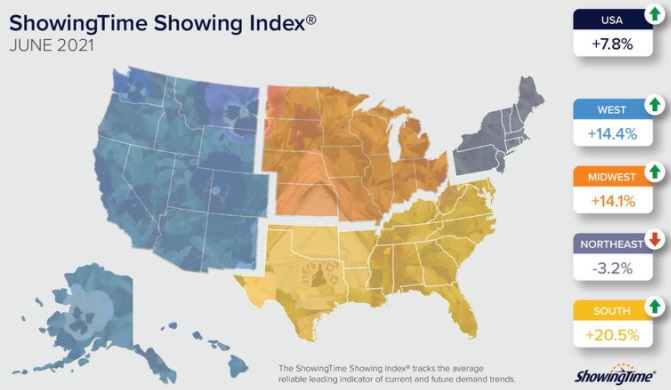
Buyers and sellers like yourself are fatigued and burned out right now, but as fall returns and the pandemic keeps easing, vaccinations grow, buyers will be out in force. A price lull will only encourage more of them to return to their home search. This graph from ShowingTime shows buyers are on the hunt again (up 14.4% in the West!)
Those homeowners looking to sell their house fast will comforted with the knowledge they are selling at record highs and next year may be much higher depending on the type of property you have. And for those looking to buy and house or condo, the immediate situation is a little better with more inventory available. Housing construction starts are up of late.
The question of housing prices really comes back to American’s desire to buy or sell. If you’re considering selling, see the key posts on selling for over list price, and if you’re buying, you’ll need to expand your efforts with a thorough search for homes for sale.
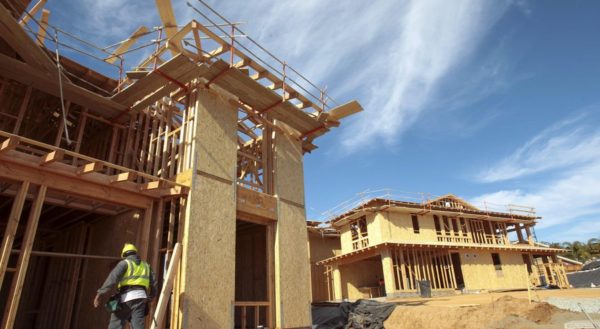
New Home Construction and the Cost of Building
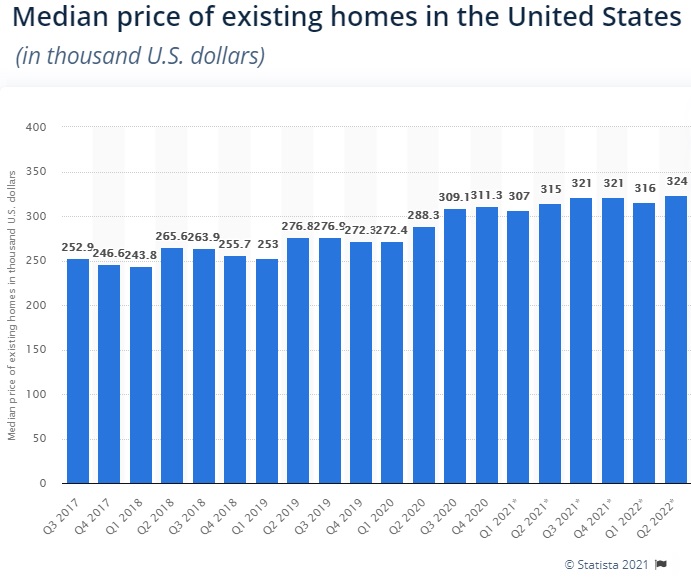
NAHB reports that median new house prices rose 6.1% to $361,800 from 12 months ago. New homes sales dropped 6.6% the lowest in 14 months. Construction was hampered by labor, rising prices, material costs.
“Home builders continue to hold back on contracts for new homes given input cost and availability uncertainties, with significant uncertainty about what it will cost to build a house and when it can be delivered.. Until builder costs and supply-chain problems become less of an impediment, it is hard to see new sales picking up significantly in the near term.” said David Berson, chief economist at Nationwide in Columbus, Ohio.
NAHB reports that housing regulations, labor and materials shortages have pushed the average new home construction cost to $297,000 per house. That includes an estimated $93,870 costs from housing regulations.
Of course, NAHB’s outcry is for a regulation of regulations to bring costs under control. Very smart but sure to draw political resistance. A lot of local and state governments have their hands in the till to extract funds. The role of NIMBYism is paramount.
Resale Home Prices Rocketing
For the immediate future, next 3 years, there is no solution for high home prices and supply. New construction cannot keep up, and the population will grow faster. New home construction was down 6.6% in June. Demand will rise continuously against supply chain and materials shortage issues. Infrastructure spending is definitely needed and it will push home prices much higher. Massive liquidity in the economy and markets will increase inflation on all products while Millennials are determined to buy their first family home.
While governments try to kill demand, more Americans oppose government mandates and will not give up on their personal dreams. It seems this generation of young buyers are more creative and determined to win in this war with government and capture their dream against all odds.
The question for home buyers and mortgage holders who have to refinance in 5 years, is whether to buy now or wait for some kind of price drop.
The threat to home prices for sellers (and some may want to sell soon) is a potential economic setback. That threat is unlikely but still very real. Before you shell out $350,000 to a million dollars for a home, consider what your mortgage might jump to in 5 years. Vicious front end loading of interest repayment on mortgages by lenders leaves you with big personal losses and still a potential bankruptcy situation in 5 years, should the economy tank after its bull run.
That’s not to say you shouldn’t buy a house, but rather setting a price limit and not going above that. In a setback, higher end homes lose their value fastest. Consider as well that Federal and state taxes will rise.
The Big Interest Rate Threat
The Fed may be forced to raise interest rates (debt, inflation, cool consumer market demand and reduce commodity prices, e.g., gasoline, EV car battery components, steel). Their failure is that refuse to see the real demand that drives Americans. As the pandemic eases, confidence and hope for the future will rise.
The US is poised to improve, however, dependence on China and the embarrassment of the increasing trade deficit with China has an expiration date. Credit has to be paid back and China would love a crashing America, where it could buy up property and businesses for pennies on the dollar. Big picture: big risks due to China.
Personal income increased $26.1 billion (0.1 percent) in June and personal consumption expenditures (PCE) increased $155.4 billion (1.0 percent) according to estimates released today by the Bureau of Economic Analysis.
Most Americans who have bought homes possess huge savings so the risk of foreclosure is low. Americans spent more in June, but personal income and savings are high overall, despite lingering unemployment. That’s due to the stimulus spending of course, which will continue. With such massive stimulus injections into the economy, a downturn is inconceivable, which is why the fears of a housing crash are subdued this summer.
Those big savings rates have encouraged the buying of expensive homes and stimulated the luxury construction market. Most of the sales in California and Los Angeles are high end priced homes. The upcoming eviction crisis will load a number of homes on the market, but they will be swallowed up by single and investor buyers. The rental housing market will not cool. Rent prices will rise more and this prevents or discourages some sellers from selling.
There is little to support the forecast of lower home prices anytime soon. Current moderation in some regions is only due to the lag in reopening. Pandemic destination cities are seeing slower growth in housing prices.
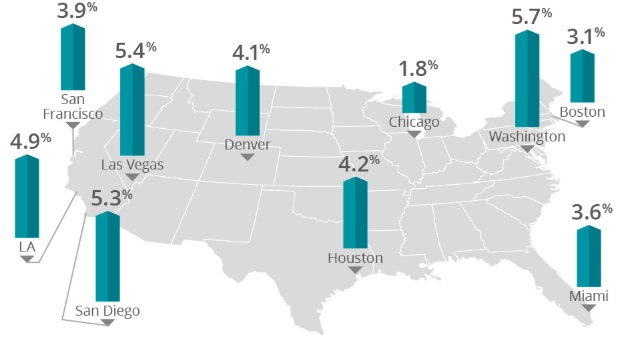
Home buyers are perplexed about whether to buy a home and sellers too about when to sell theirs. Is this a housing bubble. Are the prices in Dallas, San Diego, Denver, New York, Atlanta, Chicago, Bay Area, Boston, and Los Angeles legitimate?
Read more about home prices in June in the real estate housing market report. July stats won’t be released until July 21.
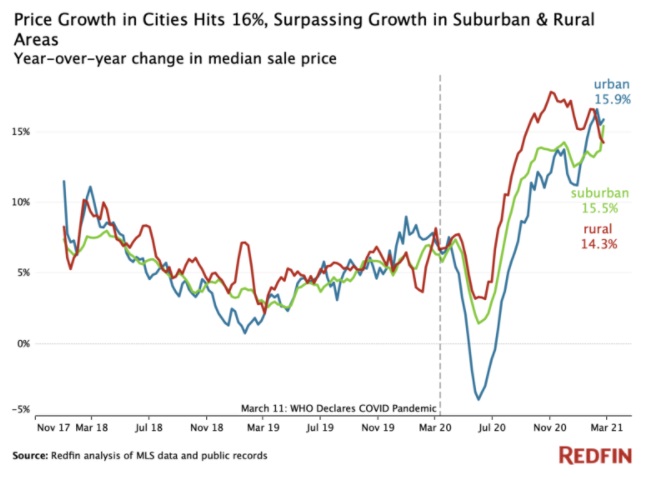
Suburban Home Prices Growing Fastest
Even with the pandemic exodus, buyers are drawn more to the suburbs, than urban or rural areas. Is this a supply issue, or is it expected they will be called back to the office after the pandemic has ended?
See more details on Florida home prices, California home prices, New York home prices, Boston home prices and Chicago home prices. Check recent home price growth in Seattle, San Antonio, Salt Lake City, Atlanta, Tampa, San Diego, San Francisco, Philadelphia, Denver, Houston, Austin and Colorado Springs.
Kiplinger conducted some home price growth research and founds some astonishing stats, particularly with respect to California real estate. Plenty of small to mid-sized towns have grown fast. Upstate NY is another hot spot for buyers. Lower housing costs, lower taxes, and work from home freedom is likely driving a good portion of the demand.
Home Price Growth in the Major US Metros
| Metro Area (data from Kiplinger.com) | Median Home Price | % Change 1 Year |
% Change Since Peak* |
% Change Since Bottom† |
Affordability Index |
| Oxnard, Calif. | 650,000 | 17.6 | 8.9 | 80.1 | 10 |
| New Haven, Conn. | 235,150 | 17.1 | -13.9 | 52.6 | 7 |
| Rochester, N.Y. | 153,000 | 16.9 | 44.4 | 60.3 | 3 |
| Buffalo, N.Y. | 160,000 | 16.5 | 85.2 | 77.1 | 4 |
| San Jose, Calif. | 1,160,000 | 16.2 | 58.2 | 117.5 | 10 |
| Hartford, Conn. | 237,500 | 15.2 | -0.7 | 33.1 | 4 |
| Modesto, Calif. | 345,000 | 14.7 | -2.2 | 147.8 | 9 |
| Ogden, Utah | 289,500 | 14.5 | 92.7 | 120.1 | 10 |
| Greensboro, N.C. | 160,000 | 14.2 | 26.5 | 53.1 | 3 |
| Columbus, Ohio | 219,000 | 13.8 | 38.7 | 93.9 | 4 |
| Lansing-East. Lansing, Mich. | 138,000 | 13.7 | 1.7 | 87.1 | 1 |
| Bridgeport, Conn. | 460,000 | 13.5 | -9.7 | 38.9 | 8 |
| Riverside-San Bernardino, Calif. | 393,000 | 13.4 | -3.1 | 111.1 | 10 |
| Stockton, Calif. | 400,000 | 13.2 | -0.8 | 147.7 | 10 |
| Seattle, Wash. | 525,000 | 12.8 | 47.5 | 117.2 | 9 |
| Cleveland, Ohio | 146,000 | 12.7 | 2.5 | 78.4 | 1 |
| Fresno, Calif. | 299,000 | 12.7 | -5.8 | 91.8 | 9 |
| Harrisburg, Pa. | 175,000 | 12.7 | 16 | 37.9 | 2 |
| Memphis, Tenn. | 156,400 | 12.7 | 11.9 | 80.8 | 2 |
| Bakersfield, Calif. | 245,000 | 12.4 | -11.6 | 89.8 | 7 |
| Milwaukee, Wis. | 228,417 | 12.4 | 0.5 | 68.9 | 2 |
| Worcester, Mass. | 260,000 | 12.3 | 18.1 | 90.6 | 6 |
| Detroit, Mich. | 181,815 | 12.1 | 7 | 136.9 | 4 |
| Winston-Salem, N.C. | 165,000 | 12.1 | 22.7 | 55.6 | 3 |
| Phoenix, Ariz. | 308,900 | 11.9 | 4.1 | 98.6 | 7 |
| Albany, N.Y. | 215,000 | 11.7 | 17.5 | 41.4 | 4 |
| Grand Rapids, Mich. | 210,000 | 11.7 | 50 | 116.1 | 5 |
| Albuquerque, N.M. | 180,000 | 11.6 | 11.5 | 55.3 | 6 |
| San Diego, Calif. | 620,000 | 11.5 | 22.3 | 91.2 | 10 |
| Tucson, Ariz. | 229,000 | 11.5 | -1 | 74.6 | 6 |
| Indianapolis, Ind. | 185,000 | 11.4 | 28.2 | 91.3 | 1 |
| Colorado Springs, Colo. | 345,000 | 11.2 | 57.7 | 85.6 | 8 |
| Philadelphia, Pa. | 240,000 | 11 | 6.9 | 48.4 | 1 |
| Springfield, Mass. | 217,500 | 10.8 | 18.1 | 67.9 | 6 |
| Knoxville, Tenn. | 196,000 | 10.7 | 35.4 | 68.2 | 3 |
| Richmond, Va. | 257,000 | 10.7 | 16 | 59.6 | 7 |
| Chattanooga, Tenn. | 189,000 | 10.3 | 46.4 | 71.7 | 4 |
| Lakeland, Fla. | 200,000 | 10.2 | -6.1 | 100.6 | 6 |
| Nashville, Tenn. | 298,000 | 10.2 | 69.3 | 94.4 | 5 |
| Cincinnati, Ohio | 179,000 | 10.1 | 28 | 72.3 | 1 |
| New Orleans, La. | 210,000 | 10.1 | 40.1 | 68.2 | 3 |
| Palm Bay, Fla. | 210,000 | 10 | 1.5 | 112.9 | 5 |
| Austin, Texas | 340,000 | 9.9 | 95.2 | 97 | 9 |
| Charlotte, N.C. | 255,000 | 9.7 | -12.4 | 77.3 | 4 |
| Chicago, Ill. | 252,000 | 9.7 | -12.4 | 77.3 | 5 |
| New York, N.Y.-N.J. | 450,000 | 9.7 | 3.1 | 51.1 | 10 |
| Virginia Beach, Va. | 250,000 | 9.7 | -5.3 | 34.9 | 9 |
| Atlanta, Ga. | 250,000 | 9.5 | 21.3 | 115 | 4 |
| San Francisco, Calif. | 930,000 | 9.5 | 31.7 | 110.3 | 10 |
| Miami, Fla. | 302,000 | 9.3 | -12.9 | 101.6 | 8 |
Buyers from California to Texas to Florida and New York are asking about a possible housing price crash, but the economy doesn’t look like it will suffer a setback anytime soon. Once the wishful thinking subsides and house construction picks up, we’ll see more confidence that house prices will continue high but more homebuyers will be successful in finding a home and more sellers will be willing to let go of their home and get on with their lives.
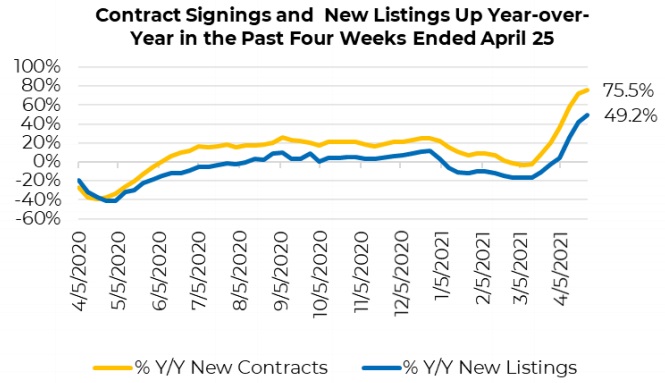
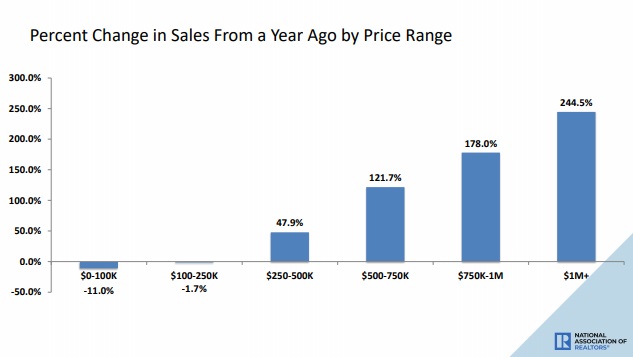
Home sales contracts timeline history chart. Screenshot courtesy of NAR.Home Sales by Price
Realtor.com housing Market Forecast 2021
Last year, price growth before the pandemic stood around 8%. Logic tells us with a recovery plus trillions in stimulus money along with low construction levels, huge demand and low mortgage rates, that home price growth could exceed 20%.
Whether it’s resale homes or new homes, the economy is reawakening with fits and starts due to the pandemic. We haven’t seen a synchronicity in this yet. Both resale and new home inventory is low, especially product in the starter home price category. Sales of luxury priced homes however are booming.
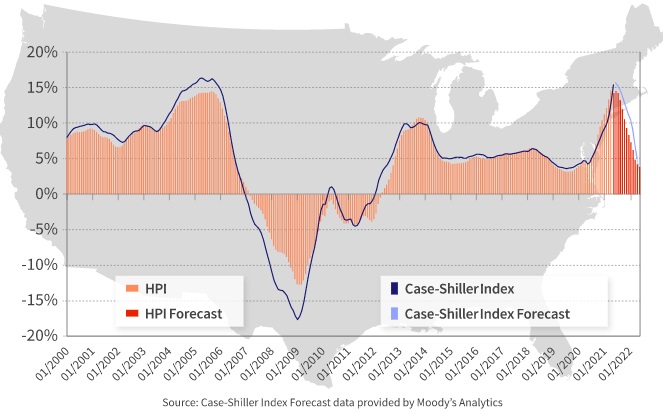
Case Shiller Price Forecasts
Last June, Corelogic predicted a home price drop in 2021. That has not transpired and likely won’t anytime soon.
Housing Price Hotness Index
NAR offers its rating of the hottest housing markets:
| City | Nielsen hotness Index | hotness_rank | hotness_rank this month | supply score | demand score | median listing price |
| kingston, ny | 234 | 47 | 190 | 100 | 49.8 | $339,900 |
| iowa city, ia | 240 | 77 | 158 | 100 | 34.8 | $281,900 |
| peoria, il | 130 | 57 | 157 | 100 | 49.5 | $138,800 |
| utica-rome, ny | 162 | 44 | 149 | 100 | 57.9 | $169,500 |
| iowa city, ia | 240 | 127 | 135 | 98 | 14.0 | $276,000 |
| lebanon, pa | 299 | 17 | 131 | 79 | 94.0 | $236,000 |
| bloomington, in | 244 | 46 | 129 | 79 | 70.6 | $315,000 |
| lincoln, ne | 155 | 52 | 124 | 100 | 49.8 | $313,480 |
| rapid city, sd | 265 | 54 | 123 | 70 | 72.6 | $305,712 |
| buffalo-cheektowaga-niagara falls, ny | 47 | 50 | 120 | 71 | 74.6 | $240,000 |
| allentown-bethlehem-easton, pa-nj | 66 | 11 | 120 | 91 | 86.3 | $269,450 |
| columbia, mo | 237 | 112 | 118 | 89 | 29.1 | $247,100 |
| springfield, il | 198 | 69 | 116 | 100 | 40.1 | $153,900 |
| springfield, mo | 110 | 91 | 115 | 74 | 51.2 | $230,000 |
| binghamton, ny | 180 | 79 | 114 | 65 | 67.6 | $162,450 |
| jacksonville, nc | 239 | 101 | 111 | 63 | 60.2 | $218,229 |
| reading, pa | 128 | 12 | 110 | 82 | 94.0 | $249,950 |
| columbia, mo | 237 | 69 | 110 | 75 | 59.5 | $249,900 |
| detroit-warren-dearborn, mi | 12 | 71 | 106 | 94 | 41.8 | $274,900 |
| columbia, mo | 237 | 35 | 105 | 89 | 69.6 | $269,900 |
| hagerstown-martinsburg, md-wv | 183 | 36 | 105 | 92 | 63.5 | $271,900 |
| iowa city, ia | 240 | 179 | 105 | 82 | 5.0 | $289,900 |
| lancaster, pa | 103 | 15 | 103 | 84 | 91.0 | $319,450 |
| decatur, al | 266 | 44 | 102 | 72 | 73.2 | $219,900 |
| allentown-bethlehem-easton, pa-nj | 66 | 52 | 102 | 64 | 82.9 | $242,900 |
| pottsville, pa | 278 | 43 | 101 | 62 | 95.3 | $108,500 |
| hagerstown-martinsburg, md-wv | 183 | 97 | 101 | 70 | 52.8 | $245,000 |
| myrtle beach-conway-north myrtle beach, sc-nc | 111 | 188 | 97 | 17 | 66.6 | $255,000 |
| johnstown, pa | 290 | 144 | 96 | 5 | 98.7 | $74,900 |
| charleston, wv | 190 | 159 | 95 | 14 | 84.9 | $148,750 |
| ann arbor, mi | 142 | 101 | 92 | 61 | 62.9 | $456,990 |
| chambersburg-waynesboro, pa | 271 | 63 | 90 | 56 | 84.3 | $241,200 |
| state college, pa | 270 | 39 | 90 | 72 | 86.0 | $337,314 |
| gainesville, ga | 246 | 58 | 88 | 75 | 66.9 | $364,900 |
| lebanon, pa | 299 | 38 | 88 | 69 | 94.6 | $239,950 |
| flint, mi | 121 | 40 | 87 | 73 | 85.3 | $208,900 |
| sebastian-vero beach, fl | 254 | 130 | 86 | 57 | 53.2 | $346,850 |
| warner robins, ga | 229 | 82 | 86 | 91 | 40.5 | $236,773 |
| yuma, az | 245 | 51 | 85 | 73 | 78.9 | $255,000 |
| redding, ca | 227 | 131 | 85 | 70 | 39.8 | $345,000 |
| cedar rapids, ia | 169 | 108 | 85 | 80 | 43.1 | $229,621 |
| harrisburg-carlisle, pa | 91 | 30 | 85 | 66 | 93.6 | $221,043 |
| fort collins, co | 147 | 68 | 84 | 79 | 60.5 | $529,500 |
| rocky mount, nc | 274 | 75 | 84 | 46 | 85.3 | $186,950 |
| redding, ca | 227 | 105 | 84 | 68 | 50.5 | $402,000 |
| la crosse-onalaska, wi-mn | 293 | 41 | 83 | 68 | 86.3 | $261,650 |
| tupelo, ms | 300 | 184 | 81 | 53 | 31.4 | $278,500 |
| st. cloud, mn | 223 | 121 | 81 | 65 | 49.2 | $287,200 |
| st. cloud, mn | 223 | 82 | 81 | 61 | 71.2 | $269,900 |
| muskegon, mi | 243 | 12 | 81 | 87 | 90.3 | $219,900 |
| york-hanover, pa | 117 | 13 | 79 | 86 | 89.3 | $255,650 |
| yuma, az | 245 | 152 | 79 | 46 | 56.2 | $232,757 |
| bloomington, il | 224 | 131 | 79 | 63 | 48.2 | $152,229 |
| boulder, co | 152 | 112 | 78 | 47 | 71.6 | $937,500 |
| atlanta-sandy springs-roswell, ga | 9 | 123 | 78 | 63 | 47.5 | $352,088 |
In the burbs and outlying towns, particularly in the midwest, we could see bidding wars.
As you can see, home prices in the major metros were doing well. These are price growth numbers from the last 12 months including the last very difficult three months.
The Migration out of Cities
People are becoming more mobile as high home costs push them out of congested, high priced urban areas to more affordable regions. The new work at home mandate means workers don’t have to be chained to their employer’s physical office location. And employers too may abandon urban sites for new locations in America’s heartland. They’re looking for the best cities to buy real estate.
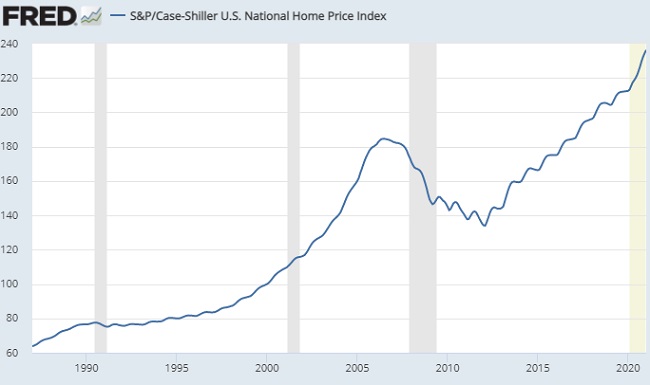
Case Shiller Home Price History Chart
The housing experts need to take another look at this chart (see also the housing crash timeline chart). Even through the worst mini-recession ever, home prices keep rising. This upward direction is steepening as it did in 2005/2006.
Is this the best time to buy a home? Will buyers get a break later on in 2020 if they wait? Is this a buyers market? It just may be the right time as the forecast is a return of price growth after the current slowdown.
Can you assess a real estate market without looking at:
- economic predictions,
- consumer confidence
- wages and employment
- GDP and trade deficits
- work at home trends
- fears of disease in high density regions, going forward
- stock market predictions?
Check the health and predictions for major cities: Los Angeles, New York, Seattle, Chicago, Philadelphia, San Diego, Miami, Boston, Bay Area, Sacramento, and Atlanta. See forecasts for California housing and Florida housing markets.
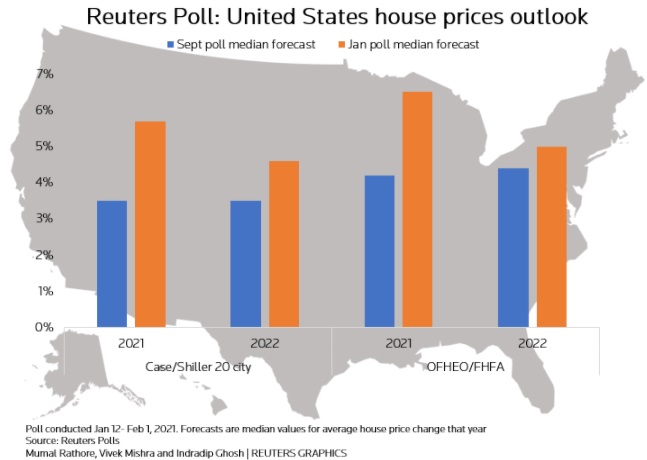
Reuters polled a number of housing market analysts at the end of a weak month in home sales, and this is still what they believe going forward to 2021:
A look back at how right they were about home price rises. With the cessation of the Corona Virus, the demand for homes will resume.
The most recent Reuters poll reflects a belief in rising home prices yet are less enthusiastic about price rises. And they’re divided. 19 of 34 analysts said U.S. housing market activity this year was likely to accelerate while the other 15 analysts believe it would slow.
The Jan. 12-Feb. 1 poll of nearly 40 housing analysts forecast the U.S. Case-Shiller house price index to rise 5.7% this year and 4.6% in 2022, the highest since polling began for both periods
And from a reuters news report on the economy, Joel Naroff, chief economist at Naroff Economic Advisers is quoted as saying, “Everything seems to be moving in the right direction in the economy … The weak links are recovering and the strengths are staying strong. The Fed is not going to continue doing nothing.” That would mean he expects the Fed to raise interest rates, and that would push the US dollar to further highs.
Best Cities to Invest?
Cross reference this compiled list of cities with a previous post on best cities to buy property.
For rental income, Silicon Valley, Los Angeles, Dallas, San Diego, and Boston might be best picks. It might be a case of the usual suspects, but start here, work your way to the best zip codes and neighborhoods, types of house, employment growth, and migration patterns of Millennials, and you may have yourself a winner (real estate investment). Who knows which cities will rule after 4 years of the Trump overhaul of the US government and US economy?
Top Home Price Growth Trends
Price growth varies each quarter. These are the latest prices from Kiplinger. California cities come in as the least affordable in the nation. New York, Washington DC, Honolulu, and Seattle are right up there.
| Metro Area | Median Home Price | % Change 1 Year |
% Change Since Peak* |
% Change Since Bottom† |
Affordability Index |
| Oxnard, Calif. | 650,000 | 17.6 | 8.9 | 80.1 | 10 |
| New Haven, Conn. | 235,150 | 17.1 | -13.9 | 52.6 | 7 |
| Rochester, N.Y. | 153,000 | 16.9 | 44.4 | 60.3 | 3 |
| Buffalo, N.Y. | 160,000 | 16.5 | 85.2 | 77.1 | 4 |
| San Jose, Calif. | 1,160,000 | 16.2 | 58.2 | 117.5 | 10 |
| Hartford, Conn. | 237,500 | 15.2 | -0.7 | 33.1 | 4 |
| Modesto, Calif. | 345,000 | 14.7 | -2.2 | 147.8 | 9 |
| Ogden, Utah | 289,500 | 14.5 | 92.7 | 120.1 | 10 |
| Greensboro, N.C. | 160,000 | 14.2 | 26.5 | 53.1 | 3 |
| Columbus, Ohio | 219,000 | 13.8 | 38.7 | 93.9 | 4 |
| Lansing-East. Lansing, Mich. | 138,000 | 13.7 | 1.7 | 87.1 | 1 |
| Bridgeport, Conn. | 460,000 | 13.5 | -9.7 | 38.9 | 8 |
| Riverside-San Bernardino, Calif. | 393,000 | 13.4 | -3.1 | 111.1 | 10 |
| Stockton, Calif. | 400,000 | 13.2 | -0.8 | 147.7 | 10 |
| Seattle, Wash. | 525,000 | 12.8 | 47.5 | 117.2 | 9 |
| Cleveland, Ohio | 146,000 | 12.7 | 2.5 | 78.4 | 1 |
| Fresno, Calif. | 299,000 | 12.7 | -5.8 | 91.8 | 9 |
| Harrisburg, Pa. | 175,000 | 12.7 | 16 | 37.9 | 2 |
| Memphis, Tenn. | 156,400 | 12.7 | 11.9 | 80.8 | 2 |
| Bakersfield, Calif. | 245,000 | 12.4 | -11.6 | 89.8 | 7 |
| Milwaukee, Wis. | 228,417 | 12.4 | 0.5 | 68.9 | 2 |
| Worcester, Mass. | 260,000 | 12.3 | 18.1 | 90.6 | 6 |
| Detroit, Mich. | 181,815 | 12.1 | 7 | 136.9 | 4 |
| Winston-Salem, N.C. | 165,000 | 12.1 | 22.7 | 55.6 | 3 |
| Phoenix, Ariz. | 308,900 | 11.9 | 4.1 | 98.6 | 7 |
| Albany, N.Y. | 215,000 | 11.7 | 17.5 | 41.4 | 4 |
| Grand Rapids, Mich. | 210,000 | 11.7 | 50 | 116.1 | 5 |
| Albuquerque, N.M. | 180,000 | 11.6 | 11.5 | 55.3 | 6 |
| San Diego, Calif. | 620,000 | 11.5 | 22.3 | 91.2 | 10 |
| Tucson, Ariz. | 229,000 | 11.5 | -1 | 74.6 | 6 |
| Indianapolis, Ind. | 185,000 | 11.4 | 28.2 | 91.3 | 1 |
| Colorado Springs, Colo. | 345,000 | 11.2 | 57.7 | 85.6 | 8 |
| Philadelphia, Pa. | 240,000 | 11 | 6.9 | 48.4 | 1 |
US Real Estate Market forecast for 2024
Please see the major metro market reports for 2024 and beyond including Denver, Dallas, Atlanta, Chicago, San Francisco, Houston, Tampa, New York, Los Angeles, San Diego, Seattle, and Philadelphia.