Was This a Turning Point for the Market?
Jeffrey Gundlach of DoubleLine interviewed on CNBC yesterday explained why the US Fed likely won’t raise rates any further, and that we’re finally on the brink of a recession.
Investors sense too that the rate hikes are just about done, and are expecting an immediate recovery. Here you can see the last 5 days have been strong with the S&P up 2.6% to its highest level in 14 months. The NASDAQ rose3.17% and the Dow was up 1.6% over that time.
There’s optimism as inflation dropped almost 1% from April to May and oil prices have dropped with an apparent oil glut on the market.
May retail sales rose and jobless claims came in lower than expected. Treasury and bond ETFs fell on the good news that supports equities. The US dollar fell to which helps with US exports and aids multinational corporations whose foreign revenue rises in US dollar terms. That’s all driven this latest market surge.
The Bull Market Launch?
But back to the question, is this the point where the recession finally begins, or will the US economy, freed from the inflationary chains, begin to flourish in a new extended bull market that could last at least 5 years?
If inflation and high rates caused the suppression of the markets, then if those were to be lifted, wouldn’t the DOW, S&P and NASDAQ roar to new highs? Well, FED chair Powell sort of promised 2 more hikes and that interest rates would not fall, perhaps for two years. Is it a fear tactic?
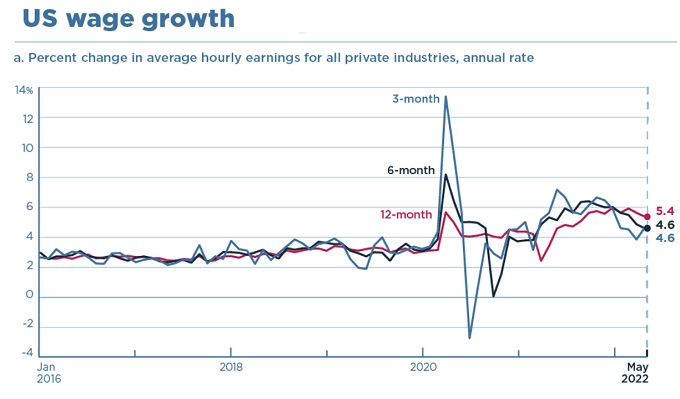
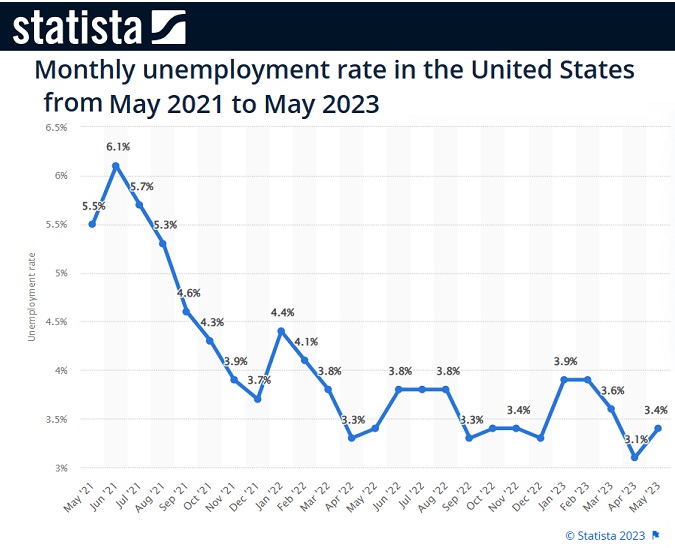
A stock market and economic resurgence is only a bad sign for the FED who are in a mood to stamp out all market growth. A revival is something they’re dead set against. Jim Cramer says the FED wants to kill wage growth and see unemployment go up and won’t stop until that is achieved.
These charts either support a strong bull stock market, or fuel for a FED hate fest. Take your pick.
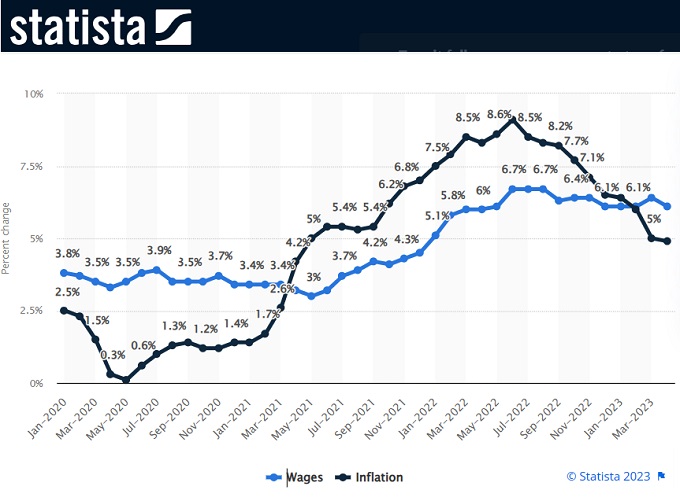
So although the FED may not raise rates beyond August, a tight M2 money supply, lingering rates, and a more cautious business environment means no big recovery is here. Consumers still have money though, and are spending during these high spend months (early summer). Despite that, inflation still dropped 1%. That’s strong downward inflation momentum and after the summer spending season, consumer spending could drop and push inflation well down.
What do Technical Indicators Say?
Luke Lango of InvestorPlace however, reports that a Holy Trinity of upside catalysts are in place to send markets soaring. Yes, he’s very confident as he cites 3 technical signals called The Triple Barrel, The Super Golden Cross and the Coppock Curve. You can read more in the Yahoo Finance article.
This video from TD Ameritrade explains the Golden Cross example and what opportunities and risks it poses for investors.
If the FED won’t allow interest rates to fall, there’s not much present to improve the economy and raise production and sales. It’s stagnation. Don’t Luango’s indicators have to cross reference the lagging effect of reduced money supply and reduced lending? Yet, those indicators are general and may not rely on any specific economic factor, positive or negative.
It will be interesting to see how the economists and investing gurus adjust their own predictions now that the rate hike regimen might be done.
Make your stock market forecast now. Is this a market turning point to jump on and find and buy the best stocks? Are you going to wait it out?
Stock Market Sectors | Stock Quotes | Economic Rebound | Forecast for US Economy | Economic Optimism | Google Finance | Tesla Stock Forecast | Stock Market Today | Stock Market Forecast 2023 | Stock Market Crash 2023 | 3 Month Stock Market Predictions | 5 Year Stock Forecast | Dow Jones 2024 | S&P Predictions | 10 Year Stock Market Forecast | Stock Trading Platforms