Mississauga Housing Market
A quick look at home prices in Mississauga should raise some homeowner’s eyebrows. It would appear a trend away from Mississauga is underway.
This might be a reflection of the slowdown in the Ontario economy, particularly manufacturing where Mississauga is so strong. In July, however the slowdown appeared to be significant. It’s also a reflection of Mississauga’s and Toronto’s condo market where investors are holding onto money losing properties that few want to buy.

The latest TRREB home sales report for July shows:
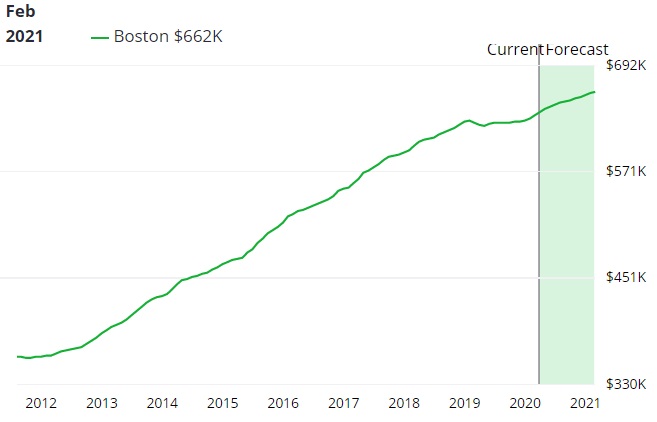
- Mississauga’s house price for July 2024 was $1,589,373 down about 3.8% lower from 12 months ago.
- Semi-detached home average price dropped 6.6% vs July 2023 to $986,872.
- Condo townhouse average price fell by 0.9% year over year to $799,271.
- Condo apartment average price fell to $631,810.
According to Zolo.ca., home prices are slumping as Mississauga slid to 17th of GTA region cities. Home prices dropped 5% year over year. Milton (-.6%), Brampton (-2.6%), and Oakville (-4%) are suffering a similar fate.
 And it might explain why listing growth is picking up fast. The stats likely show a growing state of desperation as buyers dry up and the economy lags, heading into the fall.
The B of C brought in 50 basis point of cuts, helping to drop mortgage rates, but it’s not saving the Mississauga real estate market.
As Zolo’s stats show, home prices have dropped on average by nearly 100,000 dollars since June. And detached houses saw the largest price decline.
While the news is sobering for starry eyed sellers, it’s become an inviting scene for homebuyers. They’re plotting their 2025 offer amidst even lower down payments and mortgage rates by next spring/summer season.
4 and 5 bedroom houses saw a one month price drop of 10% and 5% respectively. Smaller 2 bedroom houses however, saw 8% price growth to hit an average price of $1.2 million, the same price it was in April.

Total inventory of homes and new listings are rising briskly, while the number of home sales is down, consistent with all regions in Toronto housing market. Luxury properties are sitting on the market much longer.

The listing and sold report shows all red ink for the condo market. The GTA condo market is undergoing a meltdown, and with financing rates remaining high, many condo investors might be in for big losses. Many have been holding on for a hope of better times, but that day keeps sliding into the future. With more signs of a slowing economy, it’s hard to see investment condos being sold
TRREB July Homes Report
TRREB released its sales states for the GTA region showing home sales are down while prices rose slightly.


Forecasting sales volume and housing prices in Toronto or Mississauga is fraught with some tough challenges. Despite the economic uncertainty and the risk of fast falling prices of detached houses, semi-detached homes and condos for sale in Mississauga, buyers can see prices rising again over the next 5 years.
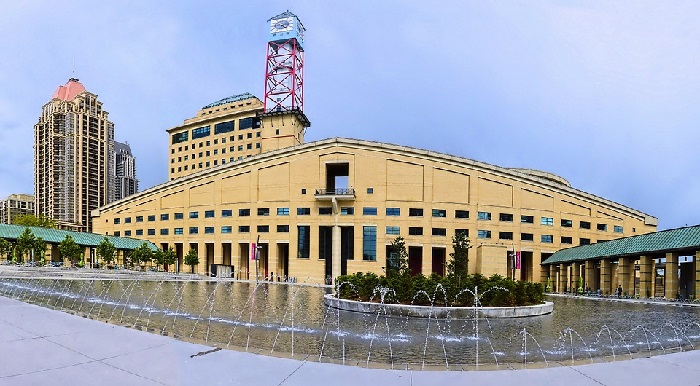
Why Move to Amazing Mississauga?
Mississauga enjoys close proximity to Toronto, Toronto International Airport and the major highways of 401, 407, and the QEW. Employment is strong, and Mississauga has had the lowest taxes of any town or city within the GTA for many years.
Mississauga also possesses a lot of land for development. There is brownfield land for residential and commercial development and there are older buildings and properties that could be developed. Mississauga has the best attitude toward business development. Lower startup costs and high market access, makes it ideal for immigrant investors wanting break into the Canadian housing market.

If you’re a buyer with an eye on launching a business or moving here to the Toronto area to work, Mississauga may be the most intelligent choice. The city has enjoyed phenomenal growth of late, which is most noticeable in Mississauga’s urban core area near Hurontario St. and Burnhamthorpe Rd which is located in the more south eastern area of Mississauga. The beautiful scenery of Lake Ontario and the night life of Toronto are very close by.
It’s difficult to have a successful economy and community unless your real estate sector is thriving and enabling the development of homes and businesses. Mississauga grows because of the pro-business sentiment here. If home and condos prices are lower in Mississauga, it’s because there’s more land to use.
Communities such as Oakville, Milton, and most districts in Toronto have less usable land and that drives up prices. Home prices are still very reasonable in this city. If you’re a first time buyer who doesn’t mind a little commute to work, Mississauga gives you a chance to own a home or condo for hundreds of thousands of dollars less than other communities in the GTA.
There is a shortage of homes for sale in Mississauga. To buy one, you’ll need a creative Realtor who knows how to get homeowners to look ahead and let go of their house. Today, you need a good Realtor to find a home. Contact me and I can connect you with someone who is competent and whom you can trust.
Housing Starts in Mississauga
Mississauga can make your dreams of home ownership in Canada come true. The employment stats and modern lifestyle, great schools, and good transportation options offer everything you need to launch and grow your family. Living here gives you a better chance at qualifiying for a home mortgage and having a financially sustainable lifestyle. Compare this to other communities with high home prices and higher unemployment, and you’ll note how Mississauga is a less risky option.
Mississauga is the largest city in the region of Peel. Other municipalities in Peel, including Brampton and Caledon have plenty of room to grow, and this may be why prices are lower here.
However, this graphic below shows that construction starts of new single detached homes in Mississauga have plummeted from 2015. This will put upward pressure on prices of homes for sale on the resale market (Mississauga mls). Peel Region reports that these 478 home construction starts is the lowest in many years.
Will Population and Employment growth In Peel Region support Real Estate Prices
 Screen Capture courtesy of Peelregion.ca
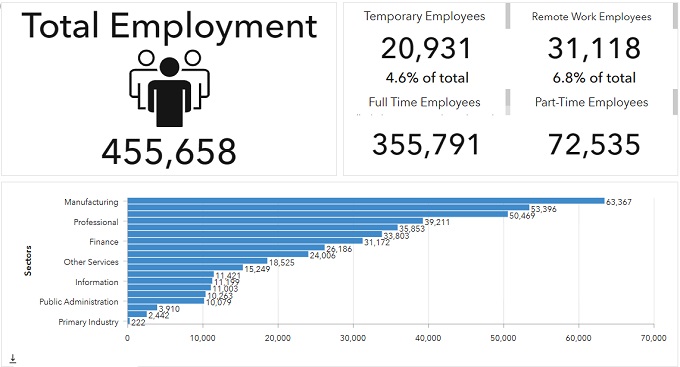
This graphic from Mississauga.ca/data has one significant stat: that 93% of employed people here are in full time jobs.

Apartment Construction Expected to Grow
This stat from the City of Mississauga’s (Mississauga Growth Forecast Housing 2008 – 2031 report), suggests they expect a huge growth in multi-unit apartment buildings to begin in 2016. The current forecast shows less growth in apartment construction. However, with housing availability at a premium, perhaps condo and apartment units will grow in number to support the population.


| Community | Sales Volume 2nd Quarter 2016 | Avg Price | Sales Volume 2nd Quarter 2015 | Avg Price | Year t Year Increase % |
| Mississauga Total | 3880 | $648,902 | 3670 | $564,898.00 | 14.87% |
| Lisgar | 191 | $684,256 | 164 | $570,554.00 | 19.93% |
| Churchill Meadows | 311 | $696,378 | 308 | $601,684.00 | 15.74% |
| Western Business Park | 0 | ||||
| Meadowvale | 258 | $529,524 | 220 | $445,083.00 | 18.97% |
| Meadowvale Business Park | 0 | ||||
| Streetsville | 81 | $716,694 | 56 | $544,594.00 | 31.60% |
| Central Erin Mills | 158 | $780,193 | 193 | $654,322.00 | 19.24% |
| Erin Mills | 245 | $683,655 | 223 | $623,228.00 | 9.70% |
| Sheridan Park | 0 | 1 | |||
| Sheridan | 71 | $943,030 | 66 | $939,655.00 | 0.36% |
| Southdown | 0 | ||||
| Clarkson | 139 | $798,627 | 171 | $633,160.00 | 26.13% |
| Lorne Park | 111 | $1,444,628 | 90 | $1,236,229.00 | 16.86% |
| Meadowvale Village | 165 | $755,922 | 154 | $652,162.00 | 15.91% |
| East Credit | 268 | $767,183 | 245 | $664,031.00 | 15.53% |
| Creditview | 38 | $656,815 | 46 | $569,183.00 | 15.40% |
| Mavis-Erindale | 3 | $1,005,833 | 0 | ||
| Erindale | 128 | $635,394 | 100 | $585,369.00 | 8.55% |
| Gateway | 0 | ||||
| Hurontario | 308 | $539,771 | 298 | $472,899.00 | 14.14% |
| City Centre | 449 | $323,932 | 398 | $297,012.00 | 9.06% |
| Fairview | 30 | $517,496 | 40 | $592,248.00 | -12.62% |
| Mississauga Valleys | 137 | $415,141 | 122 | $373,867.00 | 11.04% |
| Cooksville | 171 | $486,128 | 158 | $454,092.00 | 7.05% |
| Mineola | 66 | $1,321,843 | 53 | $1,210,223.00 | 9.22% |
| Port Credit | 47 | $900,310 | 55 | $705,185.00 | 27.67% |
| Malton | 144 | $485,141 | 151 | $424,426.00 | 14.31% |
| Northeast | 1 | 2 | |||
| Airport Corporate | 0 | ||||
| Rathwood | 94 | $661,293 | 88 | $559,067.00 | 18.29% |
| Applewood | 148 | $579,812 | 132 | $494,232.00 | 17.32% |
| Dixie | 0 | 5 | $495,580.00 | ||
| Lakeview | 118 | $782,080 | 131 | $654,881.00 | 19.42% |
This report on the Mississauga Real Estate outlook is updated monthly. Please Bookmark this page and return. See more on the Toronto housing market.