Best 30 Oil Stocks to Buy for 2027
Updated October 26, 2026 · Oil market analysis and 30 U.S.-listed energy stocks
When WTI and Brent Crude rise above $100, oil stocks become an interesting investment option.
During these leaps in oil prices, energy producers may collect extraordinary cash flows while households, airlines, trucking companies and manufacturers absorb a new round of costs. But the biggest mistake investors can make now is to assume that every oil stock benefits equally—or that $115 Brent will be the normal price throughout 2027.
The better question is which companies can keep generating attractive returns if the war drags on, and which could still justify their valuations after oil prices fall? That distinction separates durable oil businesses from stocks whose best earnings may already be in their share prices.
On October 26, WTI futures traded near $101 and December Brent near $115, as the market weighed renewed U.S.–Iran diplomacy against attacks in the Gulf. The war has turned oil from a conventional cyclical trade into an unstable mixture of physical supply disruption, military decisions, tanker risk, refining shortages and recession risk. Source: Barron’s / Dow Jones Newswires, October 26.
The Oil Market is Tight—but 2027 Could be Different
The shortage is real. The International Energy Agency (IEA) reported that global observed oil inventories were 509 million barrels below their prewar level by the end of September. September production rebounded to 102.3 million barrels a day, yet tankers, oil infrastructure, product exports and refinery operations remained vulnerable. Demand is not booming. The IEA expects global oil use to fall to about 102.4 million barrels a day in 2026 as high prices suppress consumption and economic activity.
That’s a critical distinction. This isn’t an ordinary demand-led energy bull market. Oil is expensive partly because the system cannot reliably deliver the barrels and refined products it already needs. Higher prices are themselves destroying demand.
The 2027 reversal risk is substantial. The IEA forecasts average global oil supply rebounding from 100.7 million barrels a day in 2026 to about 108.4 million in 2027, while demand recovers only to roughly 104.4 million. Those are forecasts—not a prediction of an effortless four-million-barrel daily surplus. They assume The Straight of Hormuz situation and other major interruptions will ease and production can restart. No comment is being made on the mid-term US elections and how an Anti-carbon energy in the US Democrat win would affect oil production across the US.
But the direction matters: if transportation and production normalize, a profitable 2026 oil stock can become an expensive 2027 stock very quickly. The U.S. Energy Information Administration’s October 6 base case independently puts average Brent at $84 in 2027, well below today’s spot market. Its forecast inputs were locked on October 1 and should be read as a scenario, not a current quote. Source: EIA October Short-Term Energy Outlook.
Supply
106.50
Demand
105.00
Supply
100.70
Demand
102.40
Supply
108.40
Demand
104.40
2025 values are derived from the IEA’s published year-on-year changes; 2026 and 2027 figures are forecasts. Production recovery is conditional on restored regional flows. Supply minus demand is not a direct estimate of freely accessible stocks because trade, regional availability and timing also matter. Source: IEA, October 14, 2026.
A different risk sits downstream. The IEA says fuel-product shipments out of the Middle East have recovered much less than crude exports; diesel shortages could persist into 2027. Oil prices might therefore soften while diesel and refinery margins remain unusually strong. IEA, October 14.
Why Trump has become an Oil-market Catalyst
President Trump faces two competing political and economic goals: keeping pressure on Iran and delivering the low gasoline prices he promised American voters. His actions since the February 28 outbreak of war reveal an inconsistent public message rather than a stable plan for cheap oil.
In March, Trump argued that high oil prices benefited America’s producing sector. In June, when crude prices fell, he demanded that gasoline retailers lower prices quickly. In September, he acknowledged that oil prices might remain elevated until after the November 3 midterms. This month he promoted Russian diesel supplies and agricultural fuel relief. Meanwhile, his administration authorized a 172-million-barrel U.S. Strategic Petroleum Reserve release within a 400-million-barrel coordinated IEA action. ( AP chronology; U.S. Energy Department)
President Trump’s policies and actions have sometimes welcomed the revenue flowing to American energy companies, pressed retailers on prices, pursued temporary supply remedies and continued to frame his Iran objectives as more important than short-term fuel affordability. It would be too simplistic to say he always rejects negotiations: ceasefire efforts have occurred, but their durability and terms have repeatedly broken down.
 For investors, the market-moving variable is not another speech about cheaper gasoline. It’s a credible reduction in attacks, the restoration of shipping and the reopening of dependable regional oil and fuel-product trade. A deal could push crude prices down sharply and leave recently surging producers exposed. Renewed strikes, by contrast, could support higher crude prices while increasing the probability of a recession.
The SPR has helped, but emergency stocks aren’t permanent production. Even a smooth 172-million-barrel release over the originally announced 120 days would average only about 1.4 million barrels per day; it cannot permanently replace multi-million-barrel daily losses from threatened Gulf exports. Actual deliveries depend on contracts and logistics. By October 26, U.S. SPR inventories stood at 282.6 million barrels, their lowest since 1982. Repeated withdrawals cannot replace durable daily export flows through the Middle East. Reuters, October 26.
What $115 oil means for gasoline, inflation and consumers
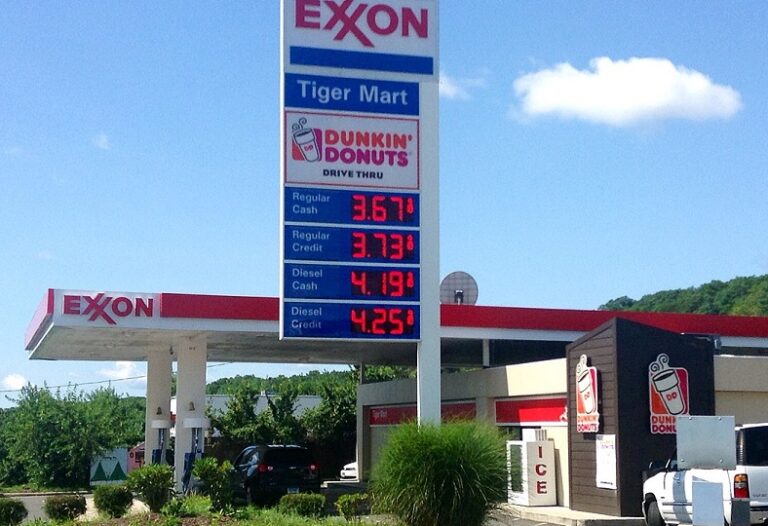
American motorists are already paying a visible war premium. AAA’s October 26 national average is $4.29 a gallon for regular gasoline versus $3.05 a year earlier. Diesel is about $6.35, compared with $3.66 last October. Diesel matters beyond truck owners: it’s embedded in food distribution, farming, construction, freight, delivery fees and the cost of moving inventory. AAA, October 26.
That pressure spreads through the economy unevenly:
- Household spending: More cash spent at filling stations leaves less for discretionary retail, restaurants, savings and travel.
- Food and groceries: Farms, refrigeration, freight and packaging absorb higher energy costs; retailers may initially protect customers by compressing margins.
- Airlines, cruises and vacations: Jet fuel and shipping expenses rise as travelers also become more price-sensitive. Airlines cannot automatically pass every cost increase through fares.
- Small businesses and manufacturers: Freight surcharges and energy-intensive materials raise working-capital requirements, often before selling prices can catch up.
- Investor sentiment: Persistent energy inflation may keep interest rates higher and make the market less willing to pay premium valuations for growth stocks.
Associated Press reporting in October cited a Moody’s Analytics estimate that the conflict had already imposed an economic burden approaching $2,000 per American household, including higher energy costs, interest costs and public spending. The estimate is broad and should not be mistaken for $2,000 in additional gasoline purchases. AP, October 2026.
Gasoline Supply is a Refinery story, not just an Oil Story
U.S. refineries operated at over 95% of capacity on average from May through September 2026, the strongest utilization for those months since 1998. Yet U.S. refining capacity is lower than in 2019 and demand for diesel exports has surged. The constraint isn’t simply how much crude exists underground; it’s how much refinery-ready oil and finished fuel can be moved through the entire supply chain. EIA, October 22.
Produced
9.64
Used*
8.80
Produced
9.59
Used*
8.85
Produced
9.47
Used*
8.69
Produced
9.35
Used*
8.77
Produced
9.23
Used*
8.41
Produced
9.75
Used*
8.98
*Demand is EIA ‘product supplied,’ a proxy for domestic consumption. The difference between production and domestic product supplied is not a surplus: imports, exports, blending adjustments and inventory changes also enter the balance. Source: EIA Weekly Supply Estimates, released October 21, 2026.
The weekly U.S. figures should not be read as a gasoline surplus just because domestic production exceeds domestic product supplied. Imports, exports, blending adjustments and inventory changes also matter. The chart illustrates production and a proxy for U.S. consumption, not the complete supply balance. EIA Weekly Supply Estimates, October 21.
Could oil at $115 cause a Global Recession in 2027?
A sustained Brent price of $115 would be a serious downside risk, especially with diesel and jet fuel expensive at the same time. But $115 is not a universal recession trigger. The economic damage depends on how long prices persist, real-income growth, interest rates, exchange rates and whether supply returns before businesses and consumers exhaust their cushions.
In its October 2026 outlook, the International Monetary Fund still projected 3.4% global growth in 2027, after 3.1% in 2026. That’s a baseline, not a guarantee, and it does not remove the risk of recession in individual oil-importing countries. IMF, October 13. A long war with repeated fuel disruptions, financing stress and weaker consumer spending could produce outcomes considerably worse than the baseline.
The U.S. stock market’s 2027 problem is profit divergence: energy firms can post outstanding earnings while consumer-facing companies face pressure on sales and margins. Airlines and the travel industry as a whole, transportation, chemicals, restaurants and other discretionary sectors are vulnerable. Bond yields could also stay elevated if energy inflation proves persistent. Conversely, a credible ceasefire would probably help those sectors and could hurt highly oil-sensitive producers.
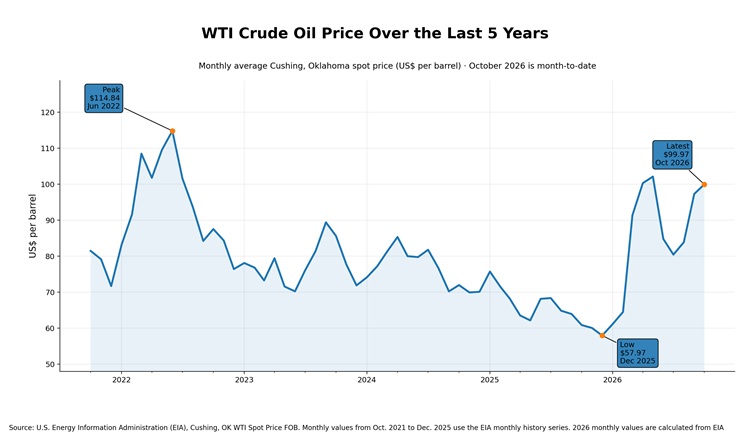
From my last report, I spoke of the opportunity coming in the oil market. As the chart reveals, demand has outstripped supply and prices have rocketed. Unexpected was the Iran war and President Trump’s insistence on ending the military regime there.
How to Invest without Buying the Top of the Energy Cycle
The 30 stocks below are a research shortlist, not a ranking by recent returns. Last year’s winners include companies that have already more than doubled. A strong past performance number tells you what the market has paid for; it does not tell you what’s left to earn.
Five questions matter more than the headline crude price: What oil price does the valuation assume? How much free cash flow is left after sustaining production? Are future earnings tied to crude, refined-fuel margins or transported volume? Can debt be serviced at $75–$85 oil? And how much of the recent rally reflects a scarcity premium that could disappear after a peace agreement?
The producers most likely to capitalize on sustained high crude include ConocoPhillips, EOG, Canadian Natural Resources and Occidental. Larger integrated firms such as Exxon, Chevron, Shell and TotalEnergies offer more sources of cash flow. Refiners Valero, Marathon Petroleum and Phillips 66 are a more targeted bet on scarce gasoline and diesel capacity, but their trailing share-price surges suggest less margin for error. Infrastructure firms tend to be steadier, though many are tied to natural gas or natural gas liquids rather than crude oil.
Best Performing Oil Stocks in the Last 3 Months
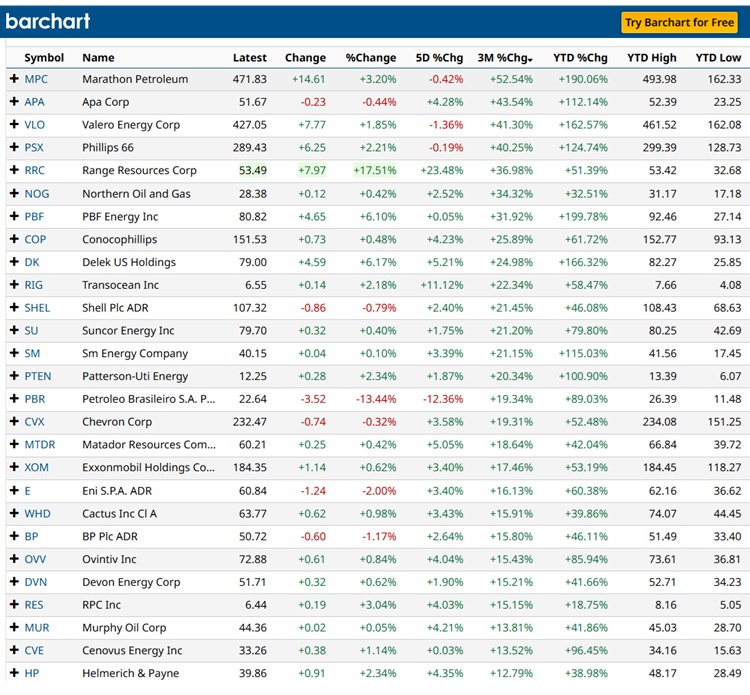
This chart from Barchart.com is ordered by price performance during the last 3 months, giving you an idea of which companies have been overperforming.
Best 30 oil and energy stocks to buy: October 2026 comparison
The comparison includes integrated oil firms, producers, refiners, oilfield suppliers and energy infrastructure companies. All share prices are U.S. dollars for U.S.-listed instruments; 1-year percentage changes are share-price performance, excluding dividends. The source is Finrange’s October 2026 energy screener snapshots, accessed October 26. Prices may be delayed or change during the session. Finrange page 1 · Finrange page 2.
October 26, 2026 market snapshot · U.S.-listed shares · Prices USD · 1-year share-price change, not total return
| Company | Symbol | Price (USD) | 1-year growth | Investor appeal & risk |
|---|---|---|---|---|
| Exxon Mobil | XOM | $183.21 | +58.77% | High-quality diversified operator. Low-cost Guyana and Permian barrels, refining and chemicals help cushion oil-price swings; premium valuation is the risk. |
| Chevron | CVX | $233.21 | +49.92% | Diversified production and cash returns. Attractive core holding if cash flow holds up; still exposed to geopolitical disruptions and expensive entry prices. |
| Shell | SHEL | $108.18 | +42.64% | Global oil, LNG and trading exposure. Diversification helps, but gas markets and capital allocation matter as much as Brent. |
| TotalEnergies | TTE | $92.78 | +49.40% | Integrated upstream, refining and LNG earnings. Useful global exposure; European taxes and capital spending can dilute the oil-price windfall. |
| BP | BP | $51.32 | +48.58% | Potential cash-flow recovery and restructuring leverage. Higher execution and balance-sheet risk than some integrated rivals. |
| Eni | E | $62.08 | +68.65% | Oil and gas portfolio with exploration upside. Attractive resource exposure but geopolitical and fiscal risks require a discount. |
| ConocoPhillips | COP | $150.80 | +71.31% | Direct exposure to higher realized crude prices with a large resource base. Powerful cash-flow torque; vulnerable if 2027 oil normalizes. |
| EOG Resources | EOG | $163.03 | +53.25% | Disciplined U.S. shale producer and strong inventory. Quality name, but cost inflation and a slower drilling response constrain upside. |
| Diamondback Energy | FANG | $205.75 | +45.38% | Permian-focused producer with scale. High sensitivity to WTI and service costs; watch capital discipline and basin differentials. |
| Occidental Petroleum | OXY | $64.17 | +50.74% | Oil-sensitive Permian producer with sizeable operating leverage. Debt and volatile cash returns add more risk in a price reversal. |
| Devon Energy | DVN | $51.39 | +55.87% | U.S. unconventional production provides crude upside. Commodity sensitivity and reinvestment demands make timing important. |
| Canadian Natural Resources | CNQ | $55.06 | +76.08% | Long-life Canadian oil-sands output supports free cash flow. Canadian heavy-crude price discounts and export access remain key. |
| Suncor Energy | SU | $79.38 | +99.30% | Oil-sands production plus refining provides an internal offset. Strong momentum raises the risk of paying for peak profitability. |
| Cenovus Energy | CVE | $32.88 | +97.60% | Integrated Canadian heavy oil and downstream exposure. Scope for margin expansion, but heavy-oil differentials are volatile. |
| Petrobras | PBR | $26.16 | +122.83% | Deepwater production and high oil leverage. Brazil political control, capital allocation and unusually large rally warrant caution. |
| Equinor | EQNR | $48.82 | +110.34% | Norwegian offshore oil and gas, favorable commodity exposure. Exceptional trailing gain makes profit-taking risk significant. |
| Valero Energy | VLO | $419.28 | +145.12% | Strong diesel and gasoline refining margin exposure. Beneficiary of product scarcity, not simply expensive crude; sharp rerating limits margin of safety. |
| Marathon Petroleum | MPC | $457.22 | +133.01% | Large U.S. refinery system and logistics exposure. Strong crack spreads help, but policy pressure and a refinery-margin reversal are risks. |
| Phillips 66 | PSX | $283.18 | +120.20% | Refining, chemicals and midstream assets. Diverse earnings, but the recent surge reflects unusually favorable product margins. |
| SLB | SLB | $53.06 | +48.09% | Global reservoir, drilling and technology provider. Gains if producers raise spending; service orders lag oil prices and global budgets. |
| Halliburton | HAL | $34.92 | +31.53% | North American completions and international exposure. More cyclical than majors as activity and pricing can weaken quickly. |
| Baker Hughes | BKR | $55.86 | +19.49% | Equipment, services and LNG technology exposure. Diversified backlog can be defensive, but not a pure oil-price play. |
| Enbridge | ENB | $48.15 | +2.64% | Crude and liquids transportation with contracted revenue. Income-oriented alternative; interest rates and regulation often outweigh spot oil. |
| Enterprise Products Partners | EPD | $37.08 | +19.65% | Liquids pipelines, storage and fractionation. Fee-based cash generation; U.S. partnership tax reporting needs consideration. |
| MPLX | MPLX | $59.13 | +19.19% | Pipelines, logistics and processing support distributions. Less crude-price leverage but concentration and partnership tax complexity. |
| Kinder Morgan | KMI | $34.43 | +33.14% | Natural gas and products pipelines. Infrastructure income rather than direct crude upside; volumes and growth projects matter. |
| Energy Transfer | ET | $20.45 | +22.24% | Extensive crude, NGL and gas network. Strong cash potential but leverage, governance and partnership taxes warrant scrutiny. |
| ONEOK | OKE | $95.83 | +39.67% | Large NGL and gathering infrastructure business. Benefits from throughput and export demand; commodity-linked volumes still fluctuate. |
| Targa Resources | TRGP | $302.37 | +99.70% | NGL gathering, processing and export infrastructure. Excellent volume exposure, but the stock has already priced in meaningful growth. |
| Williams Companies | WMB | $71.70 | +24.74% | Predominantly natural-gas pipelines. A lower-direct-oil-beta infrastructure choice; gas transport volumes and rates drive results. |
Data: Finrange energy screener, page 1 and page 2, accessed October 26, 2026. Snapshot prices can be delayed and may change; 1Y changes exclude dividends. List selected for diversity of upstream, refining, services and infrastructure—not ranked by expected 2027 returns. Some midstream names focus on natural gas/NGL rather than crude. Past returns are not a forecast.
Which Oil Stocks look Most Attractive for 2027?
For quality and staying power: Exxon, Chevron, ConocoPhillips and Canadian Natural Resources deserve close research. Their operating scale and asset depth offer a better starting point than chasing a small company’s share-price momentum. That doesn’t mean they’re cheap after the rally.
For higher sensitivity to another surge in WTI: Occidental, Devon and Diamondback have more direct crude exposure, with correspondingly sharper downside if peace returns oil toward $80. Position size matters here.
For the gasoline and diesel shortage: Valero, Marathon Petroleum and Phillips 66 are the clearest stock-market expressions of strong refining margins. But after triple-digit one-year gains, investors need to test whether current margins can last. Refiners can fall even while gasoline remains expensive if feedstock costs, regulations or weaker consumption compress the spread.
For oilfield spending: SLB, Halliburton and Baker Hughes are not automatic winners from a one-month spike. Their opportunities depend on producers approving projects, securing crews and equipment, and keeping budgets elevated into 2027. A long period of healthy prices is far more useful to their businesses than a brief panic.
For steadier cash distributions and infrastructure: Enterprise Products Partners, MPLX and Enbridge offer a different risk profile. Their income is generally more dependent on volume, contracts and financial conditions than on today’s WTI quote. Enterprise Products Partners, MPLX and Energy Transfer are partnerships with distinct U.S. tax reporting considerations.
Three oil-price scenarios investors should watch
| 2027 scenario | What it would suggest | Stocks and risks to monitor |
|---|---|---|
| Brent holds $110–$130 amid disruptions | Producers earn high realized prices; refiners may capture scarcity margins; inflation and demand destruction deepen. | COP, CNQ, EOG, OXY; VLO and MPC if crack spreads remain strong. Watch the risk of recession and weaker volumes. |
| Brent eases toward $80–$100 with an uneven recovery | Cash flows normalize, but disciplined operators can remain profitable; some fuel bottlenecks persist. | XOM, CVX, SHEL and resilient midstream assets. Avoid paying peak-cycle multiples. |
| Brent falls well below $80 after a durable resolution or demand shock | Oil-sensitive producers and the most re-rated refiners may face sharp earnings downgrades. | Focus on balance sheets, sustaining costs and valuation. Midstream isn’t immune if volumes or financing deteriorate. |
These are illustrative scenarios, not precise price forecasts. The biggest swing factor is whether physical crude and refined-product supply recovers more quickly or more slowly than demand.
The oil-stock opportunity for 2027
The oil shortage has handed the energy sector extraordinary profitability—but investors buying after a big rally need a view on what remains scarce. Production, refining capacity, diesel supply, pipelines and reliable shipping are different businesses with different drivers.
The attractive 2027 oil investment may not be the company with the biggest gain in 2026. It may be the operator with the best free cash flow at ordinary oil prices, or the refiner whose margins can stay strong after crude begins to fall. Conversely, if the war escalates and fuel supplies contract again, high-beta producers could outperform even as the broader stock market weakens.
Price matters. Supply reliability matters more. And entry valuation decides whether a good oil company becomes a good investment.
Disclosure: This article is for independent research and education, not personalized investment advice. Prices are time-sensitive. Oil and energy stocks can be volatile, and some partnership investments involve special tax reporting. Review current financial statements, commodity exposure, debt, valuation and tax treatment before investing.
=================================================

For instance, the Canadian Oil market has been kicked around and underinvested, and has received less revenue than it should. Yet those conditions are about to change. Your very best investment opportunities might be in the Canadian oil sector. Disclosure: I own shares of Transocean, Athabasca Oil Sands, and Baytex Energy. They’re beginning to soar.
Does the threat of a stock market crash and housing market crash affect the oil market? An economic collapse would certainly lower demand for oil and gasoline. See more on the stock market forecast overall, and the outlook for the last half of 2025, before making investment decisions. Knowing more might save you from a losing investment.
* The content and opinions contained in this post are those of the author and do not constitute investment advice. This information is for exploring opportunities and entertainment. Please refer to your stock investment advisor for guidance and opinions on investible oil stocks and when to buy.