California Housing Market 2026–2027: Home Prices, Sales, Inventory and Forecast
Updated November 9, 2026 | Latest monthly market data: to End of September 2026 (CAR October Report)
California’s housing market has a perennial challenge. Homes in the Golden state are pricey, transactions are scarce, and it seems neither buyers nor sellers seem particularly satisfied with expected outcomes. Home prices have held remarkably firm even as monthly sales retreat. More homes are available in some inland communities, yet a well-located house in the Bay Area can still attract serious competition.
Will California home prices fall in 2027? Will lower mortgage rates bring buyers back? The latest figures from the California Association of REALTORS® (C.A.R.) suggest a slow recovery, with enormous regional differences.
California Housing Market at a Glance
| Market indicator | Latest reading | Period / definition |
|---|---|---|
| Median existing single-family home price | $899,720 | September 2026; +1.7% year over year |
| Existing single-family sales | 260,410 | Seasonally adjusted annual rate; -6.5% year over year |
| Unsold inventory | 3.7 months | September 2026; 3.6 one year earlier |
| Median time to sell | 29 days | Existing single-family homes |
| Sales price / original list price | 98.8% | C.A.R. statewide measure |
| Median condo / townhome price | $640,000 | September 2026; -1.5% year over year |
| Households able to afford median single-family home | 19% | Third quarter 2026 |
| Qualifying annual income | $228,000 | Q3 2026; C.A.R. affordability calculation |
| Average 30-year fixed rate | 6.86% | September 2026, Freddie Mac data cited by C.A.R. |
Source: C.A.R. September 2026 Sales and Price Report and Q3 2026 Housing Affordability Report. Sales figures are annualized, not the number of homes that physically closed during September.
California Home Prices: High, but No Longer Racing Higher
The statewide median price of an existing detached house reached $899,720 in September, barely below August’s $901,420 and 1.7% above September 2025. That is a far quieter market than the pandemic-era price surge. Nevertheless, anyone shopping with a typical California income knows that a slowdown in appreciation is not the same as an affordable home.
“While the market is expected to remain subdued through the end of 2026, demand is anticipated to improve modestly in 2027 as geopolitical tension eases and economic uncertainty subsides…On the supply side, the mortgage lock-in effect will continue to keep many potential sellers on the sidelines, but housing inventory in California should loosen next year as market conditions and the lending environment normalize” — C.A.R. Senior Vice President and Chief Economist Jordan Levine.
The statewide median also hides the composition of sales. C.A.R. found that homes priced at $1 million or more accounted for 35.9% of September sales, up from 35.2% in August. A larger luxury share can lift the median even when individual property values are barely moving. Median price per square foot, at $434, was up 1.6% over the year—a steadier signal of price pressure, although not a perfect one.
You may see substantially lower prices on other websites. Zillow estimated a $761,538 typical California home value at September 30, up 0.6% annually. Redfin reported a $752,837 September median sale price for all home types, up 1.0%. C.A.R. focuses on existing detached single-family transactions. Zillow’s Home Value Index is an estimate of typical values, not a median of homes sold in one month. These aren’t interchangeable statistics.
Home Sales: The Recovery Keeps Stalling
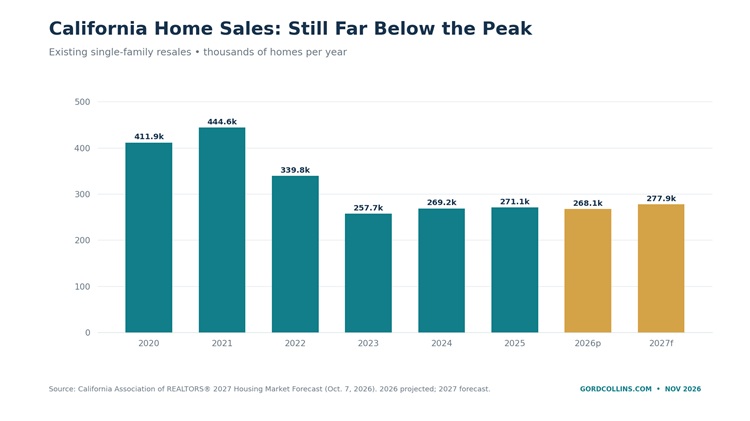
California existing-house sales ran at a 260,410 seasonally adjusted annual pace in September, down 3.4% from August and 6.5% from a year earlier. C.A.R. says sales have remained below a 300,000 annual pace for 48 consecutive months. There is no shortage of Californians who would like to move. There is a shortage of transactions that buyers and sellers could make a deal work financially.
Many owners still have mortgages at far lower rates and would face much larger payments if they moved. Prospective buyers confront high prices, financing costs, taxes and insurance. Some stay in apartments; others consider smaller homes or longer commutes.
Sales can remain weak without a dramatic price collapse: owners who don’t need to move simply wait.
The Regional Picture: Five Housing Markets Under One State Flag
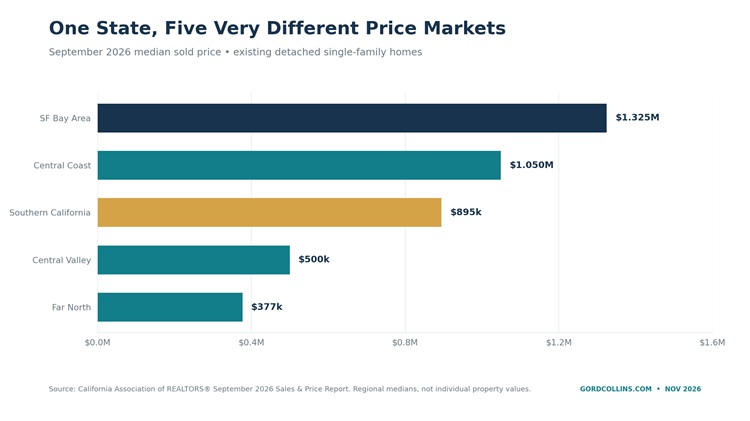
The Bay Area’s $1.325 million median is more than three times the Far North’s $377,150. Job clusters, incomes, land restrictions and geography produce very different markets.
| C.A.R. region | Sept. 2026 median | Price change YoY | Sales change YoY |
|---|---|---|---|
| San Francisco Bay Area | $1,325,000 | +1.9% | -3.1% |
| Central Coast | $1,049,500 | +4.4% | +4.4% |
| Southern California | $895,000 | +3.0% | -9.1% |
| Central Valley | $500,000 | 0.0% | -2.5% |
| Far North | $377,150 | -3.4% | -9.0% |
September 2026, existing detached houses. Source: C.A.R. Regional Sales and Price Activity. Regional sales figures are not seasonally adjusted.
The Bay Area: Technology wealth and limited supply support prices, but conditions vary. Santa Clara County’s median fell 4.0% annually while San Francisco County showed a sharp increase.
Los Angeles and Orange County: Scarce land supports prices, but Southern California sales fell 9.1% annually in September.
San Diego: Lifestyle appeal and constrained coastal supply remain attractions, but county sales fell 12.2% annually. Buyers are selective.
Inland Empire and Central Valley: Lower prices come with trade-offs in commuting, climate and job opportunities. More listings in the Inland Empire offer extra bargaining room.
California Home Prices by County
County medians reveal differences within even the largest regions. Here are ten locations that homebuyers, investors and real estate professionals frequently follow.
| County | Sept. 2026 median house price | Annual price change |
|---|---|---|
| San Mateo | $2,327,500 | +8.3% |
| San Francisco | $2,054,000 | +17.4% |
| Santa Clara | $1,920,000 | -4.0% |
| Orange | $1,480,000 | +5.6% |
| San Diego | $1,050,000 | +6.1% |
| Los Angeles | $994,670 | +1.2% |
| Riverside | $620,000 | -0.6% |
| Sacramento | $555,000 | +2.8% |
| Fresno | $429,450 | -3.5% |
| Kern | $420,000 | +3.7% |
Source: C.A.R., September 2026 County Sales and Price Activity. Medians can move sharply in smaller markets or when a different mix of homes sells. They do not measure the appreciation of an identical home.
San Francisco’s 17.4% gain does not mean every house appreciated that much. Changes in which homes sell influence the median. For pricing decisions, use recent neighborhood comparables.
Inventory: Where Buyers Have Breathing Room
The statewide unsold inventory index stood at 3.7 months in September, compared with 3.6 a year earlier. That is an improvement, but hardly a flood of homes. Historically, around five to six months is often used as a rough reference for a balanced resale market; no fixed threshold works in every neighborhood.
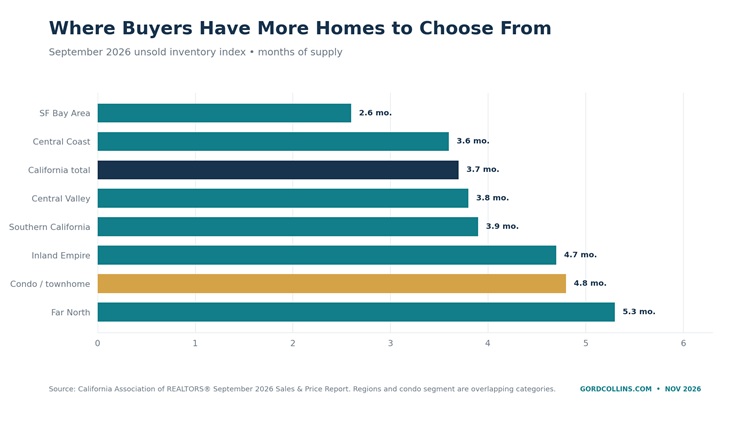
The Bay Area held just 2.6 months of supply, compared with 4.7 months in the Inland Empire and 5.3 months in the Far North. A San Mateo buyer may still have to move fast on a desirable listing. A buyer in parts of San Bernardino County may have more time to compare properties and negotiate repairs or seller credits.
The median time on market was 29 days, three days less than a year earlier. Well-priced homes can still move quickly in a slow market.
Condos and Townhouses: A Different Price and Supply Story
California’s September condo and townhome median was $640,000, down 1.5% from a year earlier. Sales in this category declined 7.5%, while available inventory reached 4.8 months—considerably more than the 3.7 months reported for detached houses. These are statewide figures, and condo conditions vary widely among cities and buildings.
Condo buyers should examine homeowners association fees, reserves, special assessments and insurance. Lower purchase prices do not guarantee lower overall costs.
Affordability Remains California’s Biggest Housing Problem
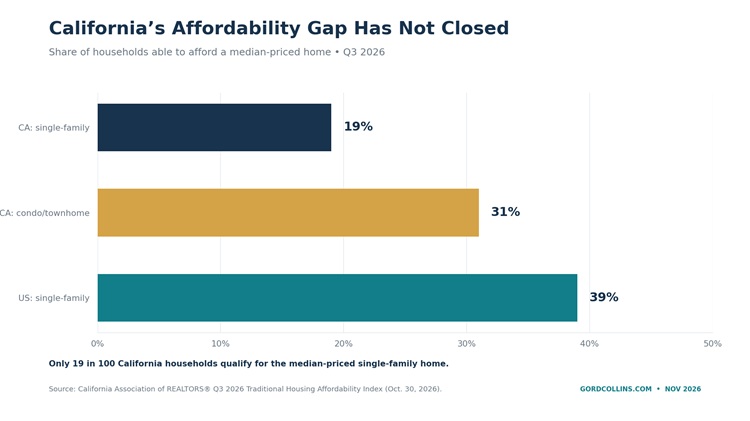
According to C.A.R., only 19% of California households could afford the median-priced existing single-family home in the third quarter of 2026. The comparable nationwide figure was 39%. California’s estimated qualifying income was $228,000 a year, supporting a modeled $5,700 monthly payment including taxes and insurance. Condo and townhome affordability was better, but still only 31%.
A 2% discount on a $900,000 house saves $18,000—welcome relief, but hardly enough to undo years of price growth and expensive financing. California needs more homes that middle-income buyers can actually afford.
Mortgage Rates and Monthly Payments
Mortgage rates averaged 6.86% in September, up from 6.35% a year earlier, according to Freddie Mac figures used by C.A.R. Rates need not return to the extraordinary lows of 2020–2021 to help sales. Even a one-point change has a substantial effect on a large California mortgage.
Here is a simple illustration using September’s $899,720 median price, 20% down, a 30-year fixed loan, and principal-and-interest payments only:
| Mortgage rate | Estimated monthly principal + interest |
|---|---|
| 5.86% | $4,251 |
| 6.86% | $4,721 |
| 7.86% | $5,211 |
Illustrative calculations; excludes property taxes, homeowner insurance, HOA fees and closing costs. Not a rate quote or C.A.R. affordability estimate.
The difference between 5.86% and 6.86% is about $470 per month, or roughly $5,640 annually. Households will watch the Federal Reserve, Treasury yields, inflation and lender spreads, but mortgage rates don’t move in lockstep with Fed policy announcements.
Building More Homes: Progress, but Not Enough Supply
Construction is essential if California wants lasting relief, particularly in locations near jobs and public transportation. U.S. Census Bureau building permit figures published by FRED show approximately 9,376 housing units authorized in September 2026 on a seasonally adjusted monthly basis. Authorizations are not completions; some projects take years to finish and others never get built.
Land, infrastructure, financing, labor, approvals and opposition all limit production. Denser construction can add housing near jobs, but new apartments are not automatically affordable ownership opportunities.
California has built too few homes in high-demand areas for years.
Migration, Jobs and the Cost of Staying in California
California remains an economic powerhouse, with prominent technology, entertainment, logistics, agriculture, healthcare and research industries. Yet growth and housing demand are never spread evenly. The state’s September 2026 unemployment rate was 5.1%, according to the Bureau of Labor Statistics series published by FRED.
The California Department of Finance estimates that the population edged down 54,000, or 0.14%, to 39.593 million between January 2025 and January 2026. Net domestic out-migration was estimated at 288,600 people in 2025. International migration, births and deaths also contribute to the overall count. For housing, the key issue is which counties gain or lose households, and at what income levels.
Residents continue relocating to lower-cost states and inland California, often in search of a more manageable housing budget.
Home Insurance Has Become Part of the Buying Decision
Wildfire exposure and rising insurance premiums have added a new layer of uncertainty. CalMatters reported in September 2026 that insurers were signaling a return to writing some new California policies, though the extent of the recovery remained disputed. The state’s last-resort FAIR Plan still plays an important role in difficult-to-insure areas.
Insurance can overturn an otherwise workable budget. Buyers should verify coverage before removing contingencies, especially in fire-exposed areas.
California Housing Market Forecast for 2027
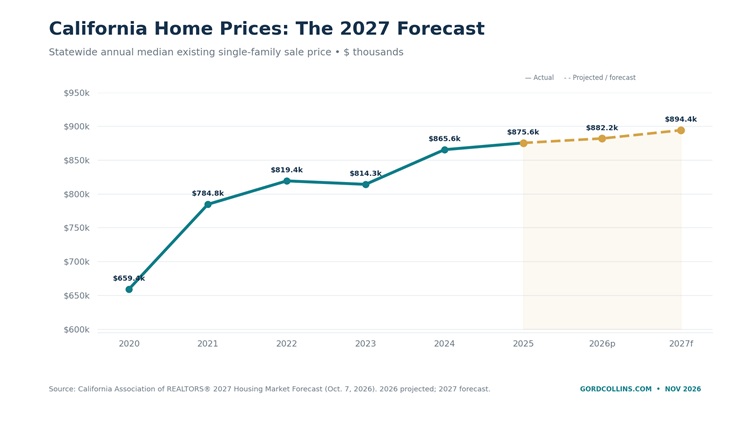
C.A.R.’s 2027 California Housing Market Forecast, released October 7, 2026, predicts a modest recovery rather than a housing boom. Existing single-family resales are projected to rise 3.7% in 2027, while the annual median price increases 1.4%. This is the association’s baseline forecast, not a guaranteed outcome.
| Calendar year | Single-family resales | Annual median home price | Annual average 30-year mortgage rate |
|---|---|---|---|
| 2025 actual | 271,100 | $875,600 | 6.6% |
| 2026 projected | 268,100 | $882,200 | 6.6% |
| 2027 forecast | 277,900 | $894,400 | 6.6% |
Source: C.A.R. 2027 California Housing Market Forecast. Annual medians in this table should not be confused with September’s single-month median of $899,720.
Chief economist Jordan Levine expects some relief as uncertainty eases and inventory loosens, while acknowledging that mortgage lock-in will continue discouraging moves. The association expects statewide housing affordability to reach only 20% in 2027. A return to sales growth, in other words, will not mean California has solved its affordability problem.
There appears to be room for home resales to recover more than for prices to accelerate. Persistent high rates or weaker hiring could still upset C.A.R.’s forecast.
What Could Push California Home Prices Higher—or Lower?
For firmer prices: Better financing conditions, stable employment, high homeowner equity, scarce coastal listings and sustained demand near high-income job centers.
For weaker prices: A rise in unemployment, more forced selling, higher insurance costs, persistently expensive mortgages or a jump in new listings without matching buyer demand.
Inland communities with extra supply could weaken even as prime coastal neighborhoods remain competitive.
Should You Buy or Sell a Home in California in 2027?
For buyers: Start with the payment you can sustain, not the maximum loan approval. Compare property taxes, insurance and HOA fees as carefully as mortgage rates. Check months of inventory and recent sale-to-list ratios for your specific ZIP code. If a home meets your needs and the numbers work, trying to pick the exact bottom can be an expensive exercise.
For sellers: September’s 98.8% statewide sale-to-original-list ratio suggests pricing discipline is increasingly important. A home priced for the neighborhood can still move. One priced on the assumption that every buyer will chase it upward may sit, require reductions and attract more demanding offers. Repairs, presentation, insurance readiness and recent comparable sales deserve attention.
For investors: Look beyond appreciation forecasts. Rent-to-price ratios, operating expenses, insurance, vacancy and local regulation can determine whether a property makes financial sense. California has high-demand rental markets, but a high asset price does not guarantee a high return.
California Housing Market FAQs
Are California home prices going down? The September 2026 C.A.R. median was up 1.7% year over year, although several counties recorded declines. C.A.R. forecasts a 1.4% increase in the statewide annual median in 2027. Local results may differ widely.
Is California a buyer’s or seller’s market? With 3.7 months of existing single-family inventory in September, the statewide market is still comparatively supply-constrained. Some inland markets are closer to balanced, while much of the Bay Area has tighter inventory.
Will there be a California housing crash? A broad crash is not C.A.R.’s baseline forecast. High prices, weak affordability and economic risks still warrant caution. A slow, steady unwinid can go on for years without experiencing a 2008-style housing market crash.
Outlook: A Market Waiting for the Next Move
California has not run out of housing demand; it has run into affordability limits and the mortgage lock-in effect. For 2027, the data support improving sales and restrained price growth, not a boom.
The statistics worth revisiting each month are simple: prices, actual sales, months of supply, mortgage rates and affordability. Together, they reveal more about the direction of California housing than any single headline number.
Home Price Growth in California Counties
Median sold prices for existing single-family detached homes, based on C.A.R. county market reports. Latest prices: September 2026.
| California County | Median Price Sept. 2026 | Median Price July 2024 | Median Price June 2023 | Price Change from 12 months ago* | Median Price May 2020 | Median Price 2017 | 7-Year Price Change (from 12 months ago)* |
|---|---|---|---|---|---|---|---|
| Alameda | $1,265,000 | $1,280,000 | $1,305,000 | -1.92% | $955,000 | $834,500 | +53.39% |
| Butte | $450,000 | $430,000 | $413,000 | +4.12% | $362,000 | $329,500 | +30.50% |
| Contra Costa | $870,000 | $916,500 | $930,000 | -1.45% | $690,000 | $570,750 | +60.58% |
| Fresno | $429,450 | $420,000 | $429,000 | -2.10% | $295,000 | $265,000 | +58.49% |
| Kern | $420,000 | $413,000 | $380,000 | +8.68% | $270,000 | $220,000 | +87.73% |
| Los Angeles | $994,670 | $909,010 | $832,000 | +9.26% | $546,930 | $581,000 | +56.46% |
| Madera | $445,000 | $424,350 | $447,000 | -5.07% | $297,500 | $240,500 | +76.44% |
| Marin | $1,678,750 | $1,594,000 | $1,700,000 | -6.24% | $1,500,000 | $1,015,000 | +57.04% |
| Merced | $430,000 | $413,500 | $390,000 | +6.03% | $285,000 | $275,000 | +50.36% |
| Monterey | $920,000 | $945,000 | $796,000 | +18.72% | $650,000 | $582,000 | +62.37% |
| Napa | $918,000 | $1,052,500 | $840,000 | +25.30% | $672,500 | $635,000 | +65.75% |
| Nevada | $550,000 | $609,480 | $574,000 | +6.18% | $410,000 | $400,000 | +52.37% |
| Orange | $1,480,000 | $1,390,000 | $1,260,000 | +10.32% | $834,550 | $708,500 | +96.19% |
| Placer | $675,000 | $670,000 | $680,000 | -1.47% | $515,000 | $485,000 | +38.14% |
| Riverside | $620,000 | $650,000 | $628,000 | +3.50% | $434,480 | $380,000 | +71.05% |
| Sacramento | $555,000 | $560,000 | $530,000 | +5.66% | $395,000 | $355,000 | +57.75% |
| San Bernardino | $531,090 | $515,000 | $470,000 | +9.57% | $320,000 | $329,750 | +56.18% |
| San Diego | $1,050,000 | $1,020,000 | $960,000 | +6.25% | $655,000 | $550,000 | +85.45% |
| San Francisco | $2,054,000 | $1,600,000 | $1,600,000 | 0.00% | $1,627,500 | $1,325,000 | +20.75% |
| San Joaquin | $549,000 | $585,000 | $530,000 | +10.38% | $415,000 | $386,500 | +51.36% |
| San Luis Obispo | $950,000 | $1,035,000 | $865,000 | +19.65% | $632,500 | $599,000 | +72.79% |
| San Mateo | $2,327,500 | $2,100,000 | $2,040,000 | +2.94% | $1,650,000 | $1,250,000 | +68.00% |
| Santa Barbara | $1,458,320 | $827,500 | $1,200,000 | -31.04% | $637,500 | $545,000 | +51.83% |
| Santa Clara | $1,920,000 | $1,880,000 | $1,800,000 | +4.44% | $1,365,000 | $1,000,000 | +88.00% |
| Santa Cruz | $1,250,000 | $1,355,000 | $1,200,000 | +12.92% | $850,000 | $727,000 | +86.38% |
| Shasta | $385,000 | $394,450 | $385,000 | +2.45% | $297,000 | $244,500 | +61.33% |
| Solano | $580,000 | $586,400 | $590,000 | -0.61% | $482,000 | $415,000 | +41.30% |
| Sonoma | $875,000 | $850,000 | $850,000 | 0.00% | $675,000 | $595,000 | +42.86% |
| Stanislaus | $491,800 | $485,000 | $460,000 | +5.43% | $350,000 | $300,000 | +61.67% |
| Tulare | $380,000 | $380,000 | $375,000 | +1.33% | $255,250 | $230,000 | +65.22% |
| Ventura | $930,000 | $972,000 | $930,000 | +4.52% | $681,250 | $575,000 | +69.04% |
| Yolo | $634,500 | $610,000 | $620,000 | -1.61% | $443,000 | $447,500 | +36.31% |
| Yuba | $457,450 | $438,400 | $445,000 | -1.48% | $320,000 | $298,250 | +46.99% |
Source: California Association of REALTORS® — September 2026 County Sales and Price Activity (released October 19, 2026).
Sources and methodology: Primary sales, price, inventory, county and forecast figures are from the California Association of REALTORS®. Alternative market measures come from Zillow and Redfin. Economic and permit data come from FRED / Federal Reserve Bank of St. Louis using BLS and Census series. Population estimates come from the California Department of Finance, and insurance reporting from CalMatters. Numbers are current as of November 9, 2026, and may be revised.
See more on the Los Angeles housing report, San Francisco housing market report, San Diego housing market report and the Sacramento housing report.
View more forecasts on the real estate housing market and the outlook for home sales in 2027 across the US.