
Insights from the 2026 AII Stock Index
The current rout of AI stocks warn us not to sell, but to investigate the upside price opportunity that’s unfolding.
Retail investors often worry about missing out on bull markets, yet the best AI stocks might be that golden win you’re all looking for. Yet, the biggest challenge for investors is a clear understanding of this technology sector, what influences it, and how these company’s stocks behave.
And if you’ve already chosen a loser, you know what I mean. How do you understand a market this complex? In this post, we get that view. I’ve collected data on the top 50 AI infrastructure and computing sector. These are the top 50 AI stocks you need to focus on.
Your big opportunity awaits.
Frightening, Discouraging Price Swing Volatility
Price volatility is hard on the nerves, and AI stock prices have been volatile in 2026, and some institutional and retail investors some have profited where others were hit by a surprise, painful slide in valuations. If this was you, don’t sell.
However, the rebound always happens. And these are the key stocks that support the next industrial revolution. These are the ones to own.
The questions you want to answer are which of these are the best to invest in, and when will they rebound strongly? Because each company has its own valuation profile and its wise to know why investors like or dislike them.
There have been brief price rebounds, driven by different events, yet weren’t lasting. You’re looking for the point where a serious price growth or return to former high price points comes about.
What Do the April and July Ai Price Recoveries reveal?
What does the index reveal about AI stock valuations, investment risk, and the next buying opportunity?
Let’s check the research to build deeper insights (Research updated October 17, 2026).
AI infrastructure stocks have delivered extraordinary gains, painful corrections, and startling recoveries in 2026. For investors who believe computing demand will keep expanding, these selloffs look tempting. Yet the central challenge isn’t finding a stock that’s plummeted 30%. Instead, you’ll want to understand what has changed in these businesses, why investors are willing to pay high prices, and what could change next.
The Collins AI Infrastructure 50 Stock Index
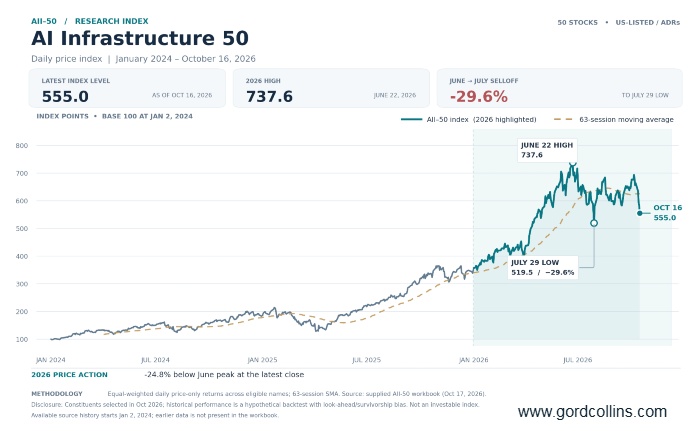
I’ve created a new research basket of 50 infrastructure stocks, named the AII-50. The data revealed two notable stock price recoveries after March 30 and July 29 mini selloffs. These stocks can be divided into some sectors where their business operates.
The same groups, particularly optical networking suppliers and specialist AI-cloud operators often saw their prices jump first. Yet, the late-July rally subsequently gave back much of that price growth. It warns you that those stocks that jump first may not maintain their growth.
It’s important for you to look deeper. What’s wonderful about AI is its ability to grasp not only the individual price actions, but collect all relevant, contributing influences of price raises and drops. Because, we’re looking for comprehensive insights and actionable information to help us invest wisely.
The current October decline may present another opportunity, but it also combines inflation, war-related energy costs, high borrowing expenses and new concerns about the economics of AI spending. Any investor who confuses strong AI demand with an automatically cheap AI stock could be in for another unpleasant surprise.
Why Can Good AI companies Become Bad Investments?
That’s a key question to answer before you take this dive into speculative investing. And it’s precisely the expertise you need before investing in anything.
Stock markets value the cash flows a business might produce over many years, adjusted for uncertainty and the return investors could earn elsewhere. Extraordinary projected growth can happen while prices decline.
That matters across the entire AI infrastructure supply chain. A chipmaker can report rising orders while its share price falls because investors cut the earnings multiple they’re willing to pay. A data-center operator can sign long-term contracts yet struggle because it needs billions of dollars in financing before it can deliver the promised capacity. A power-equipment supplier can carry a healthy order backlog while investors question whether the share price already anticipates several years of growth.
Higher Treasury yields make distant profits less valuable in present-value terms. Higher corporate borrowing costs can also make expansion more expensive and reduce the equity value left after debt obligations.
This is why a 40% share price decline isn’t proof of a 40% discount to intrinsic value. The investor’s task is to decide whether the earnings trajectory has deteriorated, the valuation has normalized, or a financing problem has emerged that could permanently damage shareholders.
In March 2026: Oil and Interest Rates Triggered a Selloff
The first 2026 price drop case study began with a shock outside the technology sector. The Iran war threatened energy shipments through the Strait of Hormuz. On March 26, Brent crude settled at $108.01 a barrel, the US 10-year Treasury yield reached approximately 4.4%, and the Nasdaq confirmed a correction of roughly 11% from its earlier record, according to [Reuters’ March 26 market report](https://www.reuters.com/world/china/global-markets-wrapup-1pix-2026-03-26/).
For AI stocks, expensive energy raised inflation concerns, inflation raised fears about interest rates, and higher rates undermined valuations based on years of future growth. There were also worries about whether hyperscalers would eventually scale back their extraordinary spending commitments. The pressures reinforced one another and a collapse happened.
The Collins AII-50 index fell about 12.8% from March 25 to March 30. It then rose 10.8% over the three trading sessions ending April 2. That was an aggressive rebound, but it wasn’t yet proof that the economic threat had disappeared.
The next down phase mattered. A two-week US–Iran ceasefire announcement in early April helped oil retreat sharply. Brent settled at $94.75 on April 8, a roughly 13% one-day drop, according to [Reuters’ oil-market coverage](https://ca.marketscreener.com/news/us-crude-futures-fall-12-04-to-100-90-bbl-after-trump-announces-two-week-ceasefire-ce7e50dad88cf126).
Meanwhile, semiconductor results helped answer a different question: was demand for AI computing still expanding? On April 16, [TSMC reported](https://www.sec.gov/Archives/edgar/data/1046179/000104617926000199/a1q26e_withguidancexfinal.htm) first-quarter US-dollar revenue growth of 40.6% year over year and a 66.2% gross margin. Those figures supplied evidence of real operating demand, not merely speculative share-price enthusiasm.
By May 29, the Collins AII-50 stood 66.2% above its March 30 low. Looking back, we see geopolitical relief ignited the recovery, while continuing semiconductor demand gave the market a reason to sustain that. Both of these price drivers mattered. Neither was seen with certainty by investors trying to predict the exact low on March 30.
In July 2026, Investors Questioned the Returns from AI Spending
The next correction during 2026 exposed a different source of weakness. Between June 22 and July 29, the Collins AII-50 lost 29.6%, even though the long-term case for AI computing hadn’t evaporated. Investors were increasingly asking what hundreds of billions in infrastructure expenditure would eventually earn.
It’s an uncomfortable question for the biggest cloud platforms and an even more urgent one for specialist GPU-cloud operators. Contracts and reported revenue can grow quickly, but data centers, power connections, servers and accelerators require substantial cash up front. If financing becomes more expensive—or investors demand proof of profitability sooner—equity prices can fall steeply.
AI infrastructure value is supported by sound future profit projections, and speculation.
The downside was amplified by crowded positioning and forced sales. [Reuters reported](https://uk.marketscreener.com/news/situational-awareness-portfolio-sinks-67-in-july-on-ai-stock-rout-letter-shows-ce7f50dbd18af027) that the AI-focused hedge fund Situational Awareness suffered a 67% portfolio loss in July and unwound much of its public-equity exposure. Such liquidation can force strong and weak companies down together.
That kind of event can create opportunities, but it doesn’t tell investors which securities are fundamentally mispriced.
Then came a clearer catalyst – Hyperscaler revenue reports/guidance. On July 29, Microsoft reported quarterly revenue of $90 billion, up 18% year over year, and strong cloud performance. Its guidance reassured markets that cloud growth could continue alongside heavy AI infrastructure investment. Reports showed Microsoft shares jumped more than 15% on July 30 and chip stocks rallied broadly.
The Collins AII-50 index advanced 17.3% over the first three trading sessions after July 29 and reached 31.6% above that low by August 17. Yet by October 16 it had fallen 18.8% from the August 17 level. Strong hyperscaler earnings initiated an impressive rally, but they could not permanently settle questions about valuations and financing across the entire industry.
That is the distinction retail investors must recognize: confirmation that AI spending continues is not confirmation that every supplier or developer deserves its previous stock price.
Which AI infrastructure Stocks Rebounded Fastest?
This is where a defined stock universe provides more insight than an anecdote about Nvidia. The AII-50 tracks 50 companies across chips, fabrication equipment, networking, servers, power and cooling, and specialist computing/data centers. We compared individual returns in the first three trading sessions after both the March 30 and July 29 lows.
Index data reveals networking and optical companies averaged 15.5% in the first rebound in March and 22.0% in the second during July. Specialist AI cloud and data-center companies averaged 11.8% and 25.1%, respectively. By comparison, the chip-and-silicon group averaged 10.5% and 11.4%. Power, cooling and construction rose 6.9% and 16.7%.
Some individual moves were remarkable. Applied Optoelectronics gained 22.0% in the first three April sessions and 44.0% in the comparable July window. CoreWeave rose 18.9% and 41.0%; Nebius gained 17.9% and 43.4%. Lumentum, Coherent and Astera Labs also appeared among the recurring early leaders.
These movements suggest that investors rushed back into stocks perceived to have high growth sensitivity. However, it doesn’t show that those companies were the safest investments, cheapest on fundamentals, or destined to outperform next time. Many of them had price additional declines after August.
Which Stocks are Most Likely to Rebound?
To separate historical rebound behavior from investment quality, I’ve created the AII-50 Index Rebound Leadership Ranking. It combines both initial three-session reactions, their performance through 20 sessions, and consistency across the two episodes. The score is descriptive: it measures what happened during two deliberately selected periods, not the probability of gains in a future rebound.
**[INSERT THE INTERACTIVE AII-50 REBOUND RANKING HERE]**
AII-50 Rebound Leadership Ranking
Compare the April and July 2026 rebounds, subsequent follow-through and current price momentum.
| Rank | Company / sector | Company perspective / risk | ||||||
|---|---|---|---|---|---|---|---|---|
| 1 | Applied OptoelectronicsAAOINetworking & Optical | 95.6 | +22.0% | +44.0% | +54.9% | -26.6% | -31.3% | Optical components led both rebounds; exceptional price sensitivity makes execution, customer orders and downside discipline critical. |
| 2 | CoreWeaveCRWVAI Cloud & Data Centers | 91.1 | +18.9% | +41.0% | +48.7% | -16.0% | -27.9% | GPU-cloud expansion brings sharp upside sensitivity, but debt markets and funding costs can rapidly reprice the shares. |
| 3 | Nebius GroupNBISAI Cloud & Data Centers | 89.9 | +17.9% | +43.4% | +45.6% | -9.4% | -24.0% | AI-cloud expansion produced strong reactions in both episodes; project financing, utilization and buildout timing are the key uncertainties. |
| 4 | LumentumLITENetworking & Optical | 86.7 | +26.3% | +29.5% | +38.4% | +7.7% | -8.1% | Optical supplier showed repeat early leadership; follow hyperscaler networking orders, manufacturing ramps and rich growth expectations. |
| 5 | CoherentCOHRNetworking & Optical | 84.1 | +17.5% | +29.8% | +35.5% | -18.4% | -21.7% | AI optical components support the opportunity; capacity ramps, margins and customer demand matter as much as rebound speed. |
| 6 | Applied DigitalAPLDAI Cloud & Data Centers | 83.5 | +19.5% | +27.0% | +36.0% | -35.2% | -32.2% | Data-center development exposure supported April’s jump; the economics of construction and external financing remain central. |
| 7 | Astera LabsALABNetworking & Optical | 82.0 | +16.8% | +28.6% | +49.5% | -7.5% | -8.9% | Connectivity-chip specialist; design wins can move expectations quickly, while customer concentration and valuation magnify reversals. |
| 8 | Bloom EnergyBEPower, Cooling & Construction | 81.5 | +13.5% | +33.3% | +61.3% | +12.3% | -7.8% | On-site power systems drew investor enthusiasm; watch actual deployments, project economics and margin conversion. |
| 9 | Marvell TechnologyMRVLAI Chips & Silicon | 81.0 | +22.0% | +18.6% | +62.2% | +16.9% | -1.7% | Custom AI silicon and high-speed networking exposure; large customer programs can accelerate growth or disappoint suddenly. |
| 10 | Credo Technology GroupCRDONetworking & Optical | 81.0 | +15.5% | +23.1% | +58.3% | -20.0% | -18.4% | High-speed connectivity chips rallied strongly; future upside depends on product adoption and customer program execution. |
| 11 | Onto InnovationONTOChip Manufacturing Equipment | 76.1 | +13.9% | +23.0% | +41.5% | -20.8% | -21.8% | Chip manufacturing inspection and metrology; equipment spending cycles can delay otherwise promising demand. |
| 12 | CienaCIENNetworking & Optical | 73.1 | +22.7% | +18.3% | +26.0% | -12.2% | -12.4% | Optical networking systems can benefit from bandwidth investment; order timing and service-provider spending are uneven. |
| 13 | IREN LimitedIRENAI Cloud & Data Centers | 72.8 | +10.0% | +35.6% | +37.8% | -32.9% | -33.1% | Energy-intensive compute and data-center exposure can surge in risk-on rallies; project funding and legacy mining exposure add complexity. |
| 14 | CorningGLWNetworking & Optical | 62.1 | +15.1% | +18.2% | +21.1% | -13.8% | -13.6% | Optical fiber and glass supplier; AI data-center buildout is an opportunity, but it remains a diversified business. |
| 15 | VertivVRTPower, Cooling & Construction | 60.3 | +11.6% | +17.9% | +24.3% | -29.2% | -20.3% | Power and liquid-cooling infrastructure exposure; earnings conversion and the price paid for future orders are crucial. |
| 16 | MKS InstrumentsMKSIChip Manufacturing Equipment | 59.6 | +11.5% | +20.3% | +16.4% | -33.8% | -22.1% | Materials and subsystems serving chip fabrication; cyclical customer capex can amplify swings in orders. |
| 17 | Micron TechnologyMUAI Chips & Silicon | 55.8 | +13.8% | +12.2% | +41.9% | +1.6% | -8.7% | Memory and high-bandwidth memory demand support growth; memory pricing remains distinctly cyclical. |
| 18 | Western DigitalWDCAI Servers & Storage | 55.7 | +17.2% | +14.1% | +28.4% | -31.9% | -27.5% | Mass-storage infrastructure exposure; product cycles and margins may matter more than daily AI headlines. |
| 19 | TeraWulfWULFAI Cloud & Data Centers | 54.7 | +8.6% | +24.8% | +28.8% | -38.1% | -27.5% | Data-center power and computing ambitions bring upside sensitivity; construction funding and business-mix risks remain high. |
| 20 | Advanced Energy IndustriesAEISChip Manufacturing Equipment | 52.9 | +11.4% | +17.4% | +17.9% | -15.2% | -17.5% | Precision power technology supplier; semiconductor investment cycles and orders shape near-term results. |
| 21 | Arista NetworksANETNetworking & Optical | 51.8 | +9.1% | +17.0% | +35.2% | +4.5% | -8.9% | Established data-center networking vendor; attractive demand requires scrutiny of competition and customer concentration. |
| 22 | Advanced Micro DevicesAMDAI Chips & Silicon | 49.8 | +10.9% | +12.8% | +38.4% | +5.0% | -0.1% | AI accelerators and server processors offer scale-up potential; adoption, margins and the software ecosystem are decisive. |
| 23 | Comfort Systems USAFIXPower, Cooling & Construction | 49.6 | +11.3% | +16.5% | +20.7% | -15.9% | -13.4% | Building mechanical systems can benefit from cooling and construction work; project execution and labor availability matter. |
| 24 | Everpure (formerly Pure Storage)PAI Servers & Storage | 49.2 | +9.6% | +15.7% | +40.9% | +77.3% | +15.1% | Enterprise data-storage supplier; unusually strong recent relative momentum contrasts with most of the 50-stock basket. |
| 25 | EMCOR GroupEMEPower, Cooling & Construction | 48.9 | +7.9% | +21.6% | +18.4% | -3.0% | -6.4% | Electrical and mechanical construction contractor; execution capacity and project backlog influence returns. |
| 26 | Lam ResearchLRCXChip Manufacturing Equipment | 48.4 | +9.3% | +16.8% | +24.8% | -14.0% | -14.1% | Manufacturing equipment tied to chip-production capex; watch orders and the memory investment cycle. |
| 27 | Powell IndustriesPOWLPower, Cooling & Construction | 47.8 | +9.0% | +17.9% | +27.7% | -27.7% | -15.3% | Power-distribution equipment supplier; large-project order timing and delivery capacity can drive volatility. |
| 28 | Super Micro ComputerSMCIAI Servers & Storage | 46.7 | +10.3% | +11.4% | +37.4% | +32.7% | -13.8% | AI server integrator; sales growth does not guarantee attractive margins, cash generation or predictable delivery. |
| 29 | Applied MaterialsAMATChip Manufacturing Equipment | 41.5 | +7.8% | +18.7% | +13.9% | -22.1% | -16.5% | Broad semiconductor tools exposure; cyclicality and fab-construction timelines shape the rebound profile. |
| 30 | ASE Technology HoldingASXAI Chips & Silicon | 40.8 | +6.7% | +17.9% | +31.9% | +7.1% | -1.2% | Semiconductor assembly and packaging supplier; advanced-packaging demand competes with traditional cycle risks. |
| 31 | Hewlett Packard EnterpriseHPEAI Servers & Storage | 40.1 | +8.8% | +13.1% | +23.9% | +23.7% | -3.5% | AI-oriented enterprise servers and infrastructure; margins and cash conversion are central to assessing growth quality. |
| 32 | GE VernovaGEVPower, Cooling & Construction | 39.9 | +9.9% | +11.8% | +19.6% | -14.6% | -5.1% | Power-generation and grid systems supplier; large infrastructure projects have long execution and revenue-recognition cycles. |
| 33 | EatonETNPower, Cooling & Construction | 39.7 | +5.1% | +21.1% | +18.1% | -2.5% | -7.1% | Electrical power management supports data-center builds; backlog durability and premium valuation deserve attention. |
| 34 | CelesticaCLSAI Servers & Storage | 36.4 | +14.6% | +4.1% | +17.1% | -1.1% | -9.0% | Electronics manufacturing supports AI systems; dependence on customer programs and manufacturing execution matters. |
| 35 | Quanta ServicesPWRPower, Cooling & Construction | 36.1 | +5.0% | +21.2% | +14.1% | -0.1% | -2.7% | Power transmission and grid construction; sustained utility spending may matter more than short-term AI sentiment. |
| 36 | nVent ElectricNVTPower, Cooling & Construction | 35.4 | +4.6% | +19.3% | +19.4% | -8.2% | -10.1% | Electrical connection, protection and enclosures; order growth and industrial exposure should be assessed together. |
| 37 | KLA CorporationKLACChip Manufacturing Equipment | 34.3 | +9.7% | +7.4% | +19.4% | -20.2% | -12.2% | Chipmaking process control; strong technology position but earnings remain sensitive to equipment spending cycles. |
| 38 | Dell TechnologiesDELLAI Servers & Storage | 34.3 | +5.9% | +16.1% | +25.3% | +18.3% | -8.7% | Servers and storage support AI deployments; margins, component costs and enterprise demand affect earnings quality. |
| 39 | Arm HoldingsARMAI Chips & Silicon | 32.9 | +8.9% | +6.3% | +28.3% | -15.5% | -14.6% | Processor architecture royalties offer AI-related upside; licensing economics differ from physical infrastructure producers. |
| 40 | NVIDIANVDAAI Chips & Silicon | 28.5 | +7.4% | +8.8% | +19.7% | +5.3% | -2.4% | AI accelerator leader with an established earnings base; rebound speed was lower than speculative peers, not evidence of weaker quality. |
| 41 | Modine ManufacturingMODPower, Cooling & Construction | 26.7 | +8.5% | +10.0% | +11.2% | -29.1% | -17.1% | Cooling and thermal-management exposure; industrial cycles and manufacturing capacity affect follow-through. |
| 42 | AmphenolAPHNetworking & Optical | 25.0 | +7.4% | +8.7% | +14.0% | +5.4% | -2.8% | Interconnect products serve multiple electronics markets; durable customer orders may matter more than speculative momentum. |
| 43 | Taiwan Semiconductor ManufacturingTSMAI Chips & Silicon | 24.4 | +7.1% | +8.4% | +17.7% | +2.6% | -3.8% | Advanced-chip manufacturing has strong demand visibility; capacity, geopolitics and valuation still matter. |
| 44 | BroadcomAVGOAI Chips & Silicon | 19.3 | +7.2% | +5.9% | +16.1% | -13.1% | -11.5% | Custom accelerators and networking semiconductors; large customer concentration and expectations warrant scrutiny. |
| 45 | ASML HoldingASMLChip Manufacturing Equipment | 15.4 | +5.0% | +5.9% | +11.5% | -5.6% | -5.1% | Advanced lithography systems are strategically important; customer capex and order timing explain slower rebounds. |
| 46 | HubbellHUBBPower, Cooling & Construction | 8.2 | +4.7% | +3.3% | +8.9% | -4.9% | -2.6% | Grid and electrical products have infrastructure demand drivers; typically less sensitive to sudden AI momentum shifts. |
| 47 | Constellation EnergyCEGPower, Cooling & Construction | 8.1 | -8.6% | +6.1% | +5.4% | +7.0% | -0.9% | Power generation and electricity contracts are relevant to data centers; regulation and energy pricing add distinct risks. |
| 48 | EquinixEQIXAI Cloud & Data Centers | 6.1 | +3.8% | +2.3% | +9.4% | -3.1% | -5.1% | Established colocation operator with long-lived assets; financing costs and leasing economics outweigh short-term AI trading themes. |
| 49 | Cisco SystemsCSCONetworking & Optical | 3.6 | +2.6% | +3.0% | +6.3% | -3.0% | -4.5% | Diversified networking incumbent; slower rebounds may reflect established revenue mix rather than weak customer demand. |
| 50 | Digital Realty TrustDLRAI Cloud & Data Centers | 2.9 | +3.7% | +1.6% | +6.9% | -0.2% | -5.5% | Data-center real-estate exposure; rates, lease economics, development costs and power access drive returns. |
How to read this: April 3d = March 30–April 2; July 3d = July 29–August 3; 20d avg. = average price change from each local low through the next 20 trading sessions; 3 mo. = latest ~63-session return; vs. 63d = latest price relative to its 63-trading-day average. Green/negative colors indicate observed returns, not buy or sell signals.
Rebound score (0–100): 35% rank percentile for April’s initial 3 sessions + 35% for July’s + 10% for each episode’s 20-session return + 10% for consistency (the weaker of the two early-rebound percentiles). Higher = stronger historical rebound profile in these two selected episodes; not a forecast or valuation score. Percentile ranking makes it sensitive to the chosen 50-stock universe.
Source: AII-50 research basket of 50 US-listed stocks, prices from an Excel STOCKHISTORY workbook supplied October 17, 2026. Selected 2026 constituents create hindsight/survivorship bias before that date. Price returns exclude dividends and trading costs. Data shown are a static October 16 snapshot; prices, metrics and comments do not update automatically. Verify prices and corporate actions before trading.
The rankings contain another useful surprise. Nvidia ranks far below the highest-flying speculative names by short-term rebound intensity, despite its central role in AI infrastructure and substantially different business economics. That’s not a devaluation of Nvidia. It only shows that stock price rebound speed and company quality measure different things.
A Different Valuation Test for Each AI Infrastructure Group
It’s tempting to compare every AI infrastructure stock by sales growth and a chart of its recent high. That would ignore the financial structure of the companies involved. Each of the companies operate in different segments of AI infrastructure, energy and computing.
Chipmakers and semiconductor equipment suppliers: should be evaluated through earnings power, margins, customer programs, future orders, technology leadership and the multiple of normalized profits. Nvidia and TSMC deserve a different analysis from highly leveraged computing hosts. For evidence of operating strength, [TSMC’s October quarterly results](https://investor.tsmc.com/english/quarterly-results/2026/q3) showed US-dollar revenue of $46.72 billion and a 66.4% gross margin. Those are concrete business results—not a guarantee that any current share price is attractive.
Optical and networking suppliers: are often judged by product adoption, customer concentration, shipment growth, margins and their ability to manufacture at scale. Their stock prices can react early to new hyperscaler interconnect projects, but orders may arrive unevenly and pricing expectations can run ahead of actual revenue.
Servers, storage and systems assemblers: face another problem: large sales can come with comparatively modest margins. Revenue growth deserves less emphasis than cash conversion, component costs, competitive pressure and service differentiation.
Power and cooling suppliers: benefit from spending on electricity, thermal management, grid infrastructure and data-center construction. Their backlog can give visibility, yet capacity limitations, project delays and high earnings multiples can weaken returns even during a capital-spending boom.
Specialist GPU-cloud developers: are the most financing-sensitive category in our basket. Investors need to assess signed contract economics, utilization, interest expenses, liquidity, debt maturities, dilution risk and when free cash flow might become sustainable. A long-term AI demand forecast cannot make an uneconomic project financially healthy.
This information above gives risk-on investors a way to choose between high-potential speculation and more established infrastructure exposure without pretending every stock should command the same sales or earnings multiple.
October: Could Another Leg Down Create a Better Buying Point?
Plenty of factors are combining to create a deep selloff of AI stocks. And this latest steep sell of off this month is testing both sides of the investment case at once. The [September CPI report](https://www.bls.gov/news.release/archives/cpi_10142026.htm), released October 14, showed **3.7% annual inflation**, with energy prices up **20.4%** from a year earlier. Higher fuel prices may keep inflation stubborn and reduce the room for interest-rate relief.
Geopolitical risk has returned to oil markets, while elevated bond yields and risk premiums make financing more expensive. [Reuters reported October 16](https://www.reuters.com/business/wall-st-futures-mixed-tech-wobbles-again-tesla-gains-2026-10-16/) that CoreWeave shares were under pressure as some of its bond yields exceeded 15%. That’s a direct warning for businesses dependent on repeated access to capital markets.
Meanwhile, AI demand has not clearly collapsed. TSMC’s strong October report makes that hard to argue. The tension is between demand growth and the financial cost of delivering it, along with the valuation already assigned to suppliers’ future profits.
It’s reasonable to prepare for another decline during the coming week, but it would be a mistake to portray one as certain. A new inflation surprise, rising crude or a negative hyperscaler capex revision could worsen the selloff. Strong earnings, a credible financing package or easing bond yields could produce a sharp counter-rally.
And it’s this uncertainty, complexity and sense of no control by anyone which makes investors nervous with a finger on the sell button.
The October 16th Collins AII-50 Index reading was 555.05, compared with a 63-session average of 624.66, about 11.1% below trend. Only one of the 50 stocks finished above its own 63-day average. The breadth reading points to widespread weakness, not a confirmed market bottom. One trading session of spectacular gains would not fix that technical picture.
Which Stocks Deserve to Be Considered in the Next Big Rebound Watchlist?
Rather than present a single list of the ‘best stocks to buy,’ we might focus on three types of opportunity.
Established earnings generators such as Nvidia, TSMC and leading equipment suppliers may offer more transparent fundamentals, but a good company at an excessive multiple can still disappoint. Check forward earnings assumptions rather than measuring cheapness solely from the 52-week high.
Infrastructure-growth suppliers in networking, optical equipment, power and cooling may respond quickly as capex guidance improves. Rebound history helps identify their share-price sensitivity; a second test of customer orders and margins helps identify whether the rally is likely to last.
Speculative AI-cloud developers (not the same as neo cloud companies) may deliver the largest percentage gains if fears about funding subside. But leverage and dilution can destroy equity value even where customers still want capacity. Size speculative positions for a large further loss, not merely the potential upside from the previous bounce.
For every best ai stock candidate, we compare the last two rebounds with the company’s subsequent drawdowns and present financing needs. The most useful distinction may be between a stock just capable of rallying and a strong business capable of compounding shareholder value.
Five Signs that the Recovery is Becoming More Durable
Hyperscaler capital spending deserves the first place on a watchlist, but its context matters. Is cloud revenue increasing? Are new customer contracts being signed? Is spending guidance stable? And is cash generation keeping pace with construction and computing costs?
Then check borrowing markets. Narrower credit spreads and improved financing terms would be particularly meaningful for the most capital-intensive AI developers. Falling oil prices and less pressure on Treasury yields would also reduce some of the valuation strain.
Finally, examine the stocks themselves. A broader share of the AII-50 moving above its 63-day average, leadership spreading beyond the most speculative names, and gains holding for 10 to 20 sessions would be stronger evidence than another spectacular three-day rebound.
No single indicator predicts the next low. But reading demand, valuation, financing and market breadth together offers investors a clearer basis for committing money than guessing which stock will bounce the furthest.
The Collins AII-50 Index Research Methodology
The The Collins AII-50 Index is a custom, equal-weight, price-only research basket of 50 US-listed AI infrastructure companies (excluding hyperscaler buyers) while including key suppliers such as Nvidia. Index returns were calculated from the daily closes stored in my October 17 Excel STOCKHISTORY workbook. The March 30 and July 29 lows were identified retrospectively; the early rebound windows are the following three trading sessions. A 63-trading-day moving average measures recent price trend.
Via AI computing and analysis of, these specific 50 companies were selected in 2026, so pre-selection history is a hindsight-based backtest, not a live investable index. Things can change, and like the S&P500, NASDAQ, or Russell Indexes, listed stocks change.
See more on stock market predictions from experts and the market forecast.
** Stock price changes exclude dividends, fees and taxes. Selected prices, corporate actions and changing business profiles should be independently verified by you before any buying or selling. Errors can happen. This index and explanation is for education purposes only. Make your buy and sell decisions carefully, using your preferred knowledge source.