Residential Real Estate Market Outlook
February Sees a Big Rebound for Housing
March 21, 2024. Normally, a quiet month, February 2024 saw big increases in completed sales, listings, along with a slight rise in prices. It bodes well for this summer’s sales season as the FED indicates 75 basis points in interest rate cuts for 2024.
The key to the current market and future market is the FED interest rate. And the FED says it will cut 3 times this year for 75 basis points off. But there’s no certainty that inflation will be tamed.
The context of the current market beside mortgage rates, is about how buyers want more listings, having a downpayment, and finding affordable home prices. They’re getting some of their wishes with more homes listed, however they’re not at affordable prices. Will they find the home features they want? Most of this month’s housing activity was at the higher-priced home segment and even fewer homes at under $200k are available. However, as you’ll see below, a huge of new construction homes are about to be release this year.
For buyers, the waiting is painful. Millennials, the top buyer demographic is desperate to start a family and their age is advancing and they’re trying to gather money from relatives to become first-time buyers. Homeowners too want to sell but aren’t willing to give up their low rate mortgage for one twice that rate.
The Housing Market at a Turning Point
Expected lower mortgage rates could be the catalyst for new attitudes from prospective buyers. The January Case-Shiller Index, TD’s Annual First-Time Homebuyer Pulse found that of those looking to buy a home in the next year, nearly three in four (74%) respondents felt optimistic about the housing market. 97% of first-time buyers have started the process of a future purchase. Their biggest fear is overpaying for a home.
However, NAR’s Realtor Sentiment® survey for February revealed lower agent confidence in the market despite rising expectations of seller traffic.
February 2024 Home Sales Activity
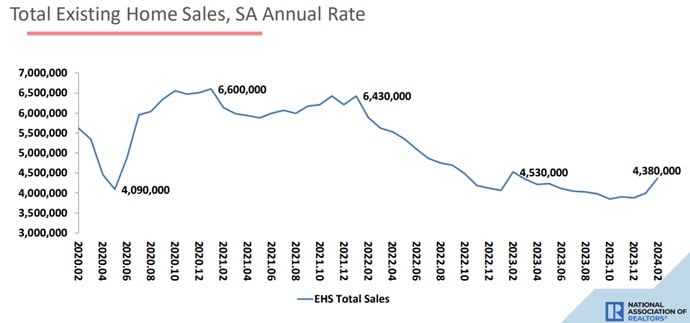
February’s sales growth was the largest in the last 12 months.
Existing home sales (all types) grew 9.5% in February to a seasonally adjusted annual rate of 4.38 million, however sales are actually down 3.3% from February 2023.
Single-family home sales grew 10.3% from January to a seasonally adjusted annual rate of 3.97 million in February. That is still down 2.7% from 12 months ago. At a seasonally adjusted annual rate of 410,000 units in February, existing condominium and co-op sales increased 2.5% from last month but declined 8.9% from one year ago (450,000 units).
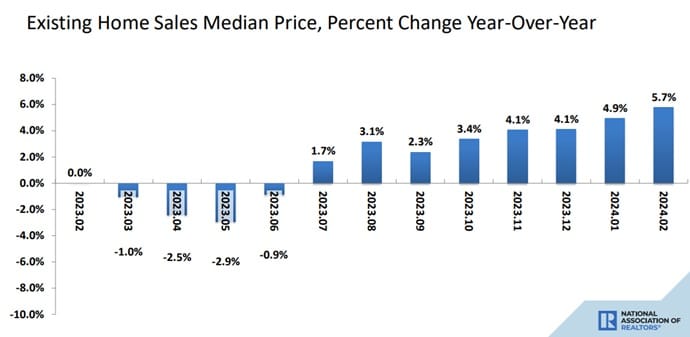
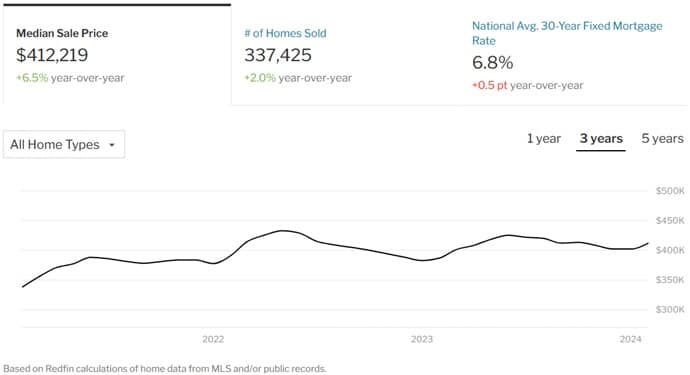
The median existing-home sales price as per NAR’s report elevated 5.7% to a new median of $363,600 from in $384,500 February 2023. That marks the 8th consecutive month of year-over-year home price gains. The median existing single-family home price rose 5.6% to $388,700 in February, an increase of 5.6% vs February 2023. The median existing condo price was $344,000 in February, up 6.7% from the previous year ($322,400).
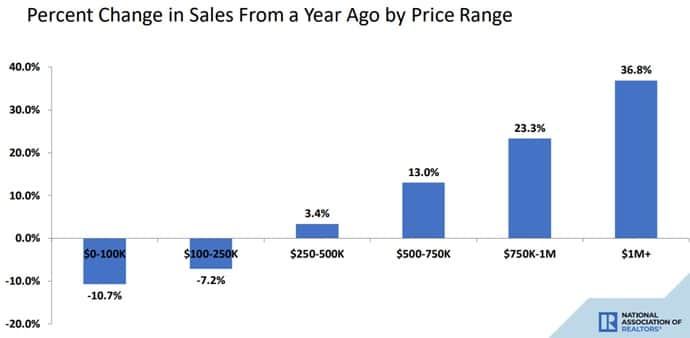
Prices are up 36.8% year over year in the $1 million dollar price level, while prices are down 7 to 10% in the <$250k segment.
Existing home prices are showing a consistent and steepening growth in 3 regions of the US, except the Northeast.
Inventory of unsold existing homes grew 5.9% from January to 1.07 million at the end of February. There is now 2.9 months’ supply of homes at the current monthly sales pace.
Sales & Prices Rise in all Except the NorthEast
In the West, existing home sales skyrocketed 16.4% month over month to an annual rate of 850,000 in February. That is still down 1.2% from 12 months previous. The median price in the West jumped 9.5 to $593,000, vs 12 months ago.
In the Mid West, Existing-home sales jumped 8.4% from one month ago to an annual rate of 1.03 million in February, yet have dropped 3.7% from 12 months ago. Median home price in the Midwest rose 6.8% to $277,600, year over year.
In the South, existing homes jumped 9.8% in February to a new annual rate of 2.02 million. That is down 2.9% from February 2023. The median price rose 4.1% to $354,200 year over year, in the south region.
And existing-home sales in the Northeast were identical to January (480,000 units), yet are down 7.7% from 12 months ago. It’s the fourth consecutive month where home sales hit 480,000 units in the Northeast. The median price in the Northeast rose year-over-year by 11.5% to 420,600.
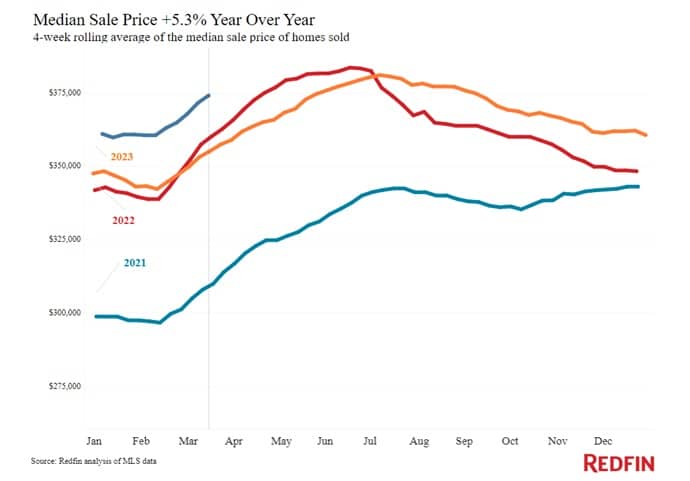
Home Prices Headed for New Records?
Redfin’s data shows prices are up 5.3% YoY, while the FED suggests rate cuts are coming. Those cuts however, will likely not be enough to encourage homeowners to give up their record low mortgage rates.
Demand for Homes Rising
Redfin’s chart below shows demand for housing is rising very sharply considering the government’s push to make buying a house impossible. While demand for single-family detached is very strong, the condo market remains more accessible and offers more supply.
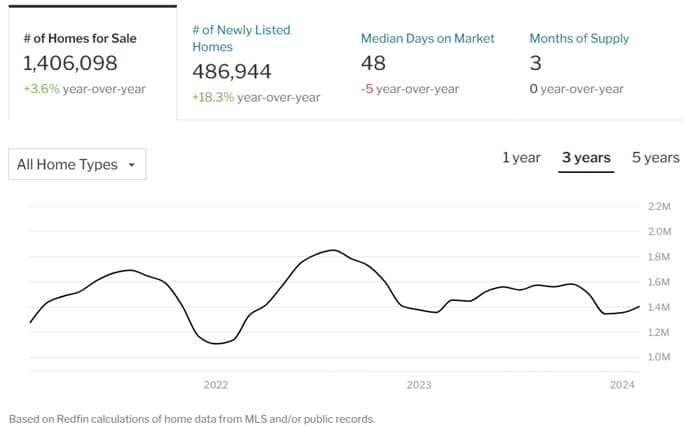
Active listings, or the total supply of homes for sale, hit the highest level in a year. They climbed 0.8% from a month earlier on a seasonally adjusted basis, however were up only 0.1% vs 12 months ago.
As the chart below from Redfin reveals, homes for sale are up 3.6% from last year, while new listings have rocketed 18.3%.
New listings should more than double from now to the summer season (June) and perhaps more if the FED does cut rates.
Redfin’s data shows new listings jumped 3.8% month over month on a seasonally adjusted basis in February, to the highest level since September 2022. It was the biggest gain in 6 months. And new listings were up 14.8% year over year, the largest annual gain since May 2021.
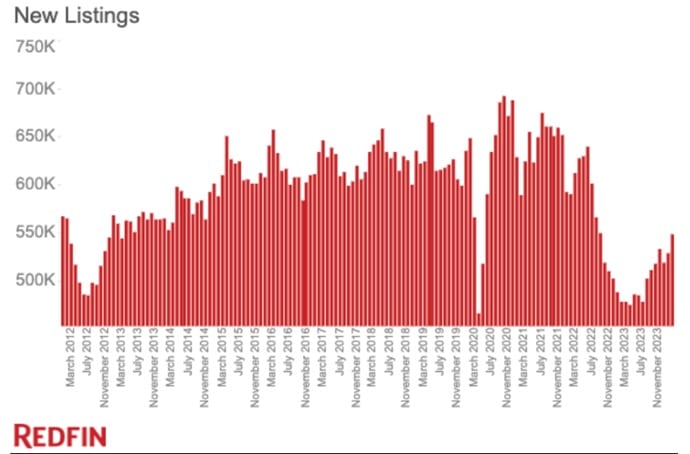
Redfin Economics Research Lead Chen Zhao said “Housing supply is finally starting to recover in a meaningful way, which is great news for buyers who for months have been competing for a tiny pool of homes for sale. Still, many house hunters are hesitant to pull the trigger because mortgage rates and home prices remain elevated.”
Redfin’s February Sales/Price Report
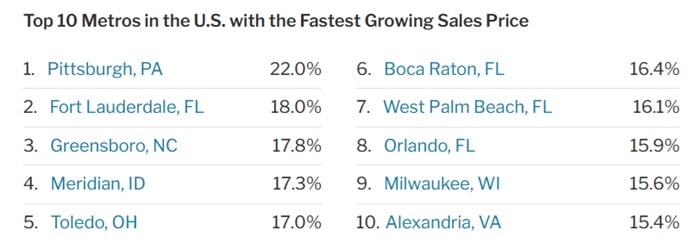
Cities with Fastest Rising Home Prices
Redfin’s Data shows strong price growth in Florida cities such as Boca Raton, Fort Lauderdale, West Palm Beach, and Orlando, and with strong growth in the heartland cities in ID, WI, and OH.
American investors are still sitting on a lot of cash and this could find its way into the housing market. See the stats for Florida and California.
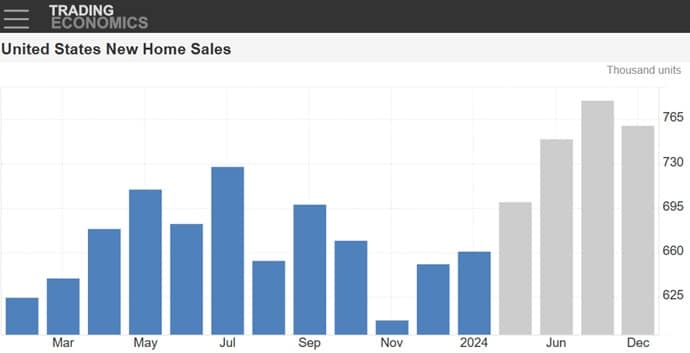
New Home Construction and Sales
A housing glut of sorts hit the market in February with single family homes growing the most. While new home sales are growing, the forecast is for big sales this year (see Toll Brothers stock).
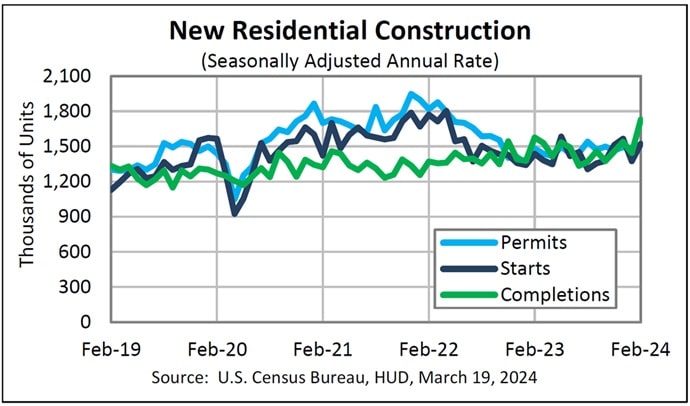
Census.org reported that privately‐owned housing building permits issued in February rose 1.9% in February, month to month, to a seasonally adjusted annual rate of 1,518,000 vs the revised January rate of 1,489,000. Permits were 2.4% higher than in February 2023.
Privately‐owned housing starts in February rose 10.7% to a seasonally adjusted annual rate of 1,521,000 and 5.9% more than 12 months ago. Single‐family housing starts in February grew 11.6% above the revised January figure of 1,012,000.
And finally, privately‐owned housing completions in February rose strongly by 19.7% to a seasonally adjusted annual rate of 1,729,000. That was 9.6% above the February 2023 rate of 1,577,000. Single‐family housing completions rose 20.2% to a new rate 1,072,000 from January.
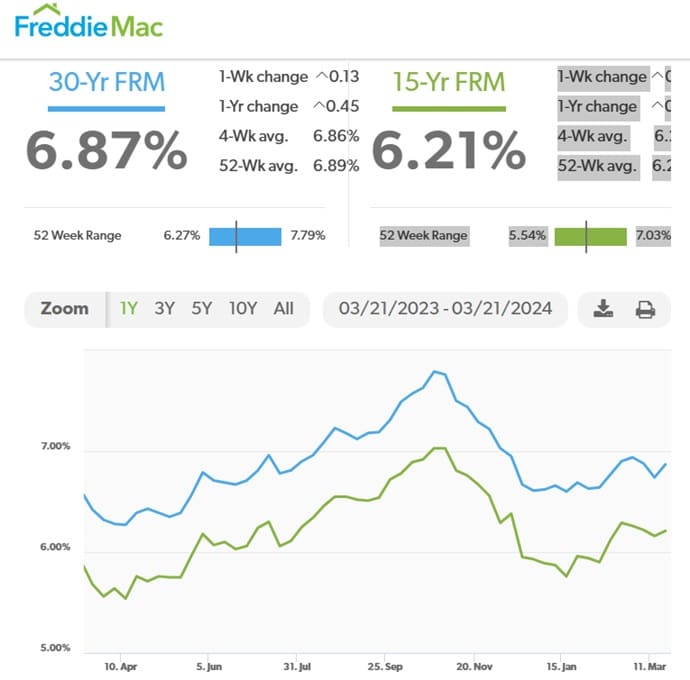
Current Mortgage Rates in March
The 30-year fixed-rate mortgage averaged 6.74% as of March 14th was down from 6.88% the week before yet is still up from one year ago when it was 6.60%. Conceivably the FED cuts could result in a 1% drop in mortgage rates which should help get more homes being listed sold. The DOJ’s anti-trust fine and new commission rules for Realtors against the National Association of Realtors may also put downward pressure on Realtor commissions which may encourage more home sales too.
See more on the Atlanta housing market, Boston housing market, New York housing market, Florida housing market and California housing market. Also, see reports on Los Angeles, San Diego, Dallas, San Antonio, Austin, Houston, Denver, Sacramento, San Francisco, Chicago, Salt Lake, Boca Raton, Tampa, Miami, and Seattle.
See more on the 5 year real estate forecast.
Factors complicating the decision to buy:
- home price history timeline charts show prices keep rising faster than inflation
- affordable housing shortages won’t be fixed anytime soon – endless demand
- rising US immigration to many states
- decreasing outmigration from states such as California
- more migration to low-tax states
- millennials still need to buy to start their families
- rent prices are rising too fast which eats down payments and savings
- those buying in high-tax states still see high prices because of lack of building homes
- weak political support for new housing zoning and builder assistance
- it’s the only investment you can live in
- mortgage rates will likely recede once this current economic crisis eases (after recession)
- big fortunes from investing in the stock market are over now
- young adults more aware of financial planning, retirement, and long-term value of a house
- rental income properties offer excellent returns, rising rents, and good tax writeoffs
- deglobalization means growing investment in US businesses and supply chains
Will home prices drop and is a housing crash possible? Experts say not likely because demand is too high and buyers do have money to purchase houses.
Stats show the luxury homes market isn’t being affected much (see stats below) so wealthy buyers aren’t anticipating a stock market crash or a housing market crash in the US. Home sales in the south are seeing a steep change and markets such as Austin Texas look very shaky with huge increases in inventory.
Buyers still can buy via 5 year adjustable rate mortgages, fully knowing that rates in the years ahead will be lower.
Stats for Major US Metros
Interested in your local real estate market? See the metro reports for Boston, Atlanta, New York, Philadelphia, Los Angeles, San Diego, Bay Area, Dallas, Denver, Houston, Chicago, and Miami. See also reports for smaller centers including Salt Lake City, Austin, Colorado Springs, San Antonio, Tampa, Seattle, and Manhattan.
28 Key Factors Driving the Home Buy/Sell Decision for 2023
- stronger economic recovery was expected in 2nd half and may happen if debt ceiling agreement is reached
- FOMO fear of missing out amidst a recovery
- fear of having to rent and be exposed to homelessness
- millennials and even Gen Z’s forming new families and need a house
- staying put — homeowners have nowhere to go thus can’t sell
- home buyers want homes in more suburban and rural areas
- work from home expected to continue although not like it was in 2021/2022, as many are returning the big metros
- government will spend more stimulus money because they want to ensure the jobs and housing markets don’t stagnate
- Fed promised to keep interest rates down but may raise them
- supply of homes making it unlikely many will be able to buy
- new home construction, material and land prices rising faster
- foreclosures may free up some homes for sale
- migration: work from home still driving buyers out of the cities for more room for a home office, backyard, space to relax
- migration: businesses moving out of high tax states to lower-tax states
- inflation plus money supply plus need for housing could inflate house prices severely
- buyers holding high-value stock portfolio’s could sell to buy a home
- buyers see a house as a potential rental income property
- many sellers want to get out of the city they live in for something new after a horrible pandemic period
- real estate is a preferred asset when cash, savings, and stocks can only go down in value
- cities and regions will still not allow housing development (NIMBYs) thus more demand for the limited available stock of homes
- homes are a safe haven (those renting saw how insecure their week to week lifestyles are where they could be left with nothing later in life, and wondering whether social security will even over their bills)
- speculation (real estate investors including the new crowdfunding buyer who can take more risk don’t see a big downside to real estate and are willing to pump money in for houses or rental properties)
- as employment grows there will be more demand for homes in 2021, 2022 and for 5 years ahead
- states such as Texas, Florida, Arizona drawing new residents (climate, jobs, business growth, low taxes)
- Los Angeles, San Francisco, New York losing residents (cost of living, taxes, failing economies)
- global economic growth will hit 4% in 2021 (world bank report)
- mortgage renewals — 225,000–500,000 homeowners could face foreclosure this year if rates go up
- homelessness and crime in the major cities will become a negative factor driving people out of the cities to the suburbs and smaller rural towns
There is no consensus on the housing market’s outlook given political battles and uncertainty about how inflation will play out and how the FED will react. The FED is not credible as a forecast source given the misstatements and predictions they’ve made.
All markets, including Los Angeles, San Diego, Denver, New York, Manhattan, Dallas, Boston, Philadelphia, Atlanta, Chicago, Austin, San Antonio, Salt Lake City, Tampa and Miami, will likely see flat home prices in 2023 and 2024 but see growth beyond that to 2027. Florida and Texas are still booming while California’s housing market forecast is looking a little brighter.
Real Estate Housing Market | Best Cities to Buy a Home | Best Time to Buy a House | Summer House Buying | Housing Market Crash | California Housing Market Forecast | Florida Housing Market Forecast | Real Estate Housing Market Predictions for Next 5 Years | San Diego Housing Market | Denver Housing Market | Boston Housing Market | Affordable Housing Crisis | New York Real Estate Housing Market | Will Home Prices Fall? | Author Gord Collins