Housing Market Update – US Real Estate Report
Housing Market 2019 Outlook
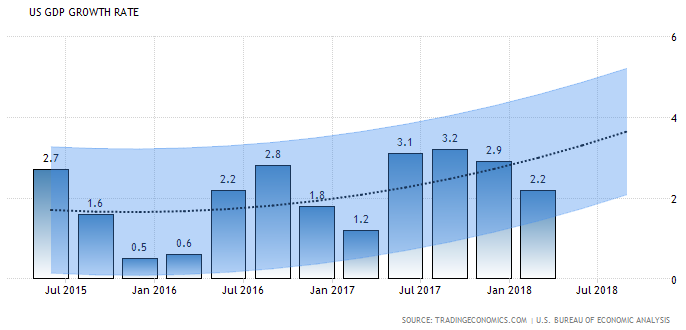
The Housing Market Predictions for 2019? The US economy is predicted to grow 3 to 5% (now 4.2%), and with house construction intact, and employment strong, and US wages rising, we’ll see more Americans buying a home. For many happy people, it will be their first home.
As you’ll read below and in the full US housing market report, there is uncertainty, but that doubt can’t hold back persistent demand from Millennial buyers from New York to Los Angeles to Miami. Even laggards such as Houston, Philadelphia, Cleveland, Pittsburgh, and even Chicago might be the darlings of 2019 and 2020. See the supporting stats below from NAR, Zillow, Tradingeconomics, FreddieMac, Forbes, Forisk, and more.
The economy is growing healthy again, not only in California, but in Florida Texas, Massachusetts and New York.
JOBS AND BUSINESSES RETURNING FROM OVERSEAS
Perhaps the most optimistic factor in the US economy is the return of high paying jobs in 2019. Momentum grows via the Presidents America First policies. This will stimulate the housing market as Millennials in particular, find themselves with lasting high paying careers.
Could jobs actually return to Ohio, Wisconsin,, Michigan, Indianapolis, Illinois, Pennsylvania, Nebraska, and other states that have suffered huge population losses (e.g., Chicago and Detroit)? Philadelphia’s housing market is expecting a 16.6% growth in prices – a sure sign the America’s outlook is sunny and bright.
Talk of future punishment against the U.S. in trade is clearly hogwash. When countries need to do business, they will gladly exchange with the U.S. as it is best trade partner in the world. Countries that play fair will enjoy the winfall.
HOUSING PRICES TO CLIMB FURTHER IN 2019
 Most experts predict a flat housing market or a buyer’s market for 2019 and 2020. Given the lack of housing availability, it might sound crazy to suggest a buyer’s market is on the horizon in Los Angeles, San Diego, or the Bay Area, but look at the stats below and you’ll see things are changing.
With strong growth in home construction, this might make it the best time to buy a house and a good time to sell your home. If mortgage rates grow a little, you should be considering buying in 2018.
BUYER MARKET SIGNALS
- rising home construction
- flattening home prices
- stable economy
- trade turmoil eases inflation
- sales-to-active listings ratio below 12%
 For a home buyer however, it’s a tough decision to buy in 2018/2019 given geopolitical uncertainty, trade transitions, a 2020 election, current high home prices, rising mortgage rates and higher housing construction costs ahead.
However, with US businesses getting a huge sales boost in their own country and with fewer imported products, Americans will enjoy low unemployment, higher wages and more access to home financing. It’s all positive and optimistic for a strong housing market and perhaps the best time to buy a house.
the industry looks attractive this year given solid economic growth … Consistent job growth, growing interest from first-time homebuyers as well as seemingly high homebuilder confidence are adding to the momentum for home building – From Zacks 2018 Outlook
MILLENNIALS AIM TO BUY A HOME
More US Millennials, that big demographic group, are into their home buying years, with more funds, hungry for their first purchase and that will ensure you have lots of competition. Millennial demand could make 2019 the best year to sell your home.
WHEN IS THE BEST TIME TO BUY A HOUSE?
Will 2019 be the best time to buy a house or condo? Probably. Housing stock on the market now isn’t so hot now but availability is going to improve in the next few years. Mortgage rates and construction costs will rise but this might not be too painful until 2020 where inflation and financing qualification could hurt prospective buyers.
If the world heads into recession in 2020, that would only ease inflation worries in the US. The US economy will stay solid as more jobs move from China to the US. Overall, home prices aren’t expected to grow much but market crashes are highly unlikely. That should make it a safer purchase for buyers and more difficult for sellers to get the best price possible.
2019 OUTLOOK POSITIVE FOR ALL PROFESSIONALS
Will 2019 be a bad time for real estate agents? Total home sales will grow in 2019 as predicted in charts below and home building will continue its growth. It’s a good time for home builders, mortgage agents, furniture makers, appliance manufacturers, solar panel installers, brick manufacturers, excavators, pool builders, designers, plumbers, electricians, and others who will fulfill this huge pent up demand for homes right across America.
THESE ARE GOOD TIMES AHEAD – PLEASE LET OTHERS KNOW ABOUT THIS POSITIVE TIME FOR THE REAL ESTATE SECTOR
HOME PRICE PREDICTIONS 2019 – TOP US CITIES
Here’s Zillow’s forecasted home prices and price growth expectations in Factors Point at Housing Market Growth
| City | 2017 Home Price | 2018 Home Price | 2019 Home Price Forecast | 1 Year Growth |
| Los Angeles | $616,000 | $674,000 | $726,000 | 7.7% |
| San Jose | $880,000 | $1,080,000 | $113,000 | 4.7% |
| San Diego | $572,000 | $625,000 | $681,000 | 6.4% |
| San Francisco | $1,210,000 | $1,330,000 | $1,420,000 | 6.2% |
| Oakland | $675,000 | $757,000 | $798,000 | 5.5% |
| Sacramento | $287,000 | $313,000 | $336,000 | 7.1% |
| Phoenix | $208,000 | $229,000 | $238,000 | 4.3% |
| Las Vegas | $218,000 | $255,000 | $276,000 | 8.0% |
| Houston | $164,000 | $176,000 | $178,000 | 1.6% |
| Dallas | $163,000 | $186,000 | $199,000 | 6.8% |
| San Antonio | $152,000 | $165,000 | $169,000 | 2.6% |
| Austin | $320,000 | $344,000 | $356,000 | 3.5% |
| Chicago | $219,000 | $225,000 | $237,000 | 5.2% |
| New York | $615,000 | $660,000 | $708,000 | 7.3% |
| Boston | $540,000 | $585,000 | $630,000 | 7.7% |
| Washington DC | $535,000 | $566,000 | $585,000 | 3.4% |
| Denver | $382,000 | $418,000 | $444,000 | 6.2% |
| Seattle | $664,000 | $767,000 | $828,000 | 8.1 |
| Philadelphia | $131,000 | $146,000 | $170,000 | 16.6% |
| Pittsburgh | $121,000 | $139,000 | $150,000 | 7.8% |
| Orlando | $204,000 | $228,000 | $244,000 | 7.3% |
| Tampa | $182,000 | $209,000 | $229,000 | 9.7% |
| Miami | $306,000 | $327,000 | $338,000 | 3.4% |
| Atlanta | $209,000 | $235,000 | $242,000 | 3.3% |
| Cleveland | $43,200 | $504,000 | $54,100 | 7.4% |
| Indianapolis | $117,000 | $127,000 | $123,000 | -2.7% |
| Minneapolis | $235,000 | $257,000 | $276,000 | 7.1% |
The above chart reveals a rosy picture for home sellers. Cities such as Tampa, Orlando, Las Vegas, and Sacramento are looking bright for sellers. Keep in mind, the 1 year price forecasts for 2019 are based on the unusual price jump during last April. Compared to last summer however, the price growth rate will be much higher.
Los Angeles, San Francisco, San Jose, San Diego continue their steady price growth. Based on improving conditions for US companies, all US cities, including those in the depressed US midwest cities will enjoy great economies.
Housing price forecasts depend on availability, construction, job growth, wages, mortgage rates, and consumer confidence. All factors are positive for growth in construction and purchase for the next 5 years. It will be quite a while before demand is satiated.
Overall, the US economic predictions are very positive that means optimism reigns for smart real estate investors and home buyers. Although rising trade tensions and tariffs could hamper global GDP, the effect on the US economy will still be positive. Any reduction in the US international trade deficit and a return of investment funds to the US will make a big impact on housing.
Rising employment, wages, new business startups, reduced corporate tax, and less competition from cheap producers and some protection of American industry will ensure 2019 is another boom year economically. Investment in US business will continue in 2019.
FREDDIE MAC FORECAST SNAPSHOT 2019 |
|||
| Summary | 2017 | 2018 | 2019 |
| 30 Year Fixed Rate Mortgage | 4% | 4.6% | 5.1% |
| Total Home Sales | 6,120,000 | 6,320000 | 6,440,000 |
| Housing Price Growth | 7.3% | 7% | 3.1% |
| Total Loan Originations | $1,865 | $1,750 | $1,744 |
| Real GDP Growth | 2.6% | 2.7% | 2.1% |
| Unemployment Rate | 4.4% | 4% | 4% |
| Housing Starts | 1,200,000 | 1,310,000 | 1,400,000 |
| Total Home Sales | 6,120,000 | 6,320,000 | 6,440,000 |
| Chart data courtesy of Freddie Mac and ECONOMIC & HOUSING RESEARCH GROUP | |||
As suggested in the oil price forecast, (oil close to $70 a barrel now), shale oil production could reduce cash outflows to OPEC and raise revenues for US producers. US producers are pumping out 14 million barrels a day, something OPEC is very concerned about.
HIGH TECH MANUFACTURING RETURNS TO THE US
Can smartphones, chips, robots, and autonomous cars be built in the US? In fact, they can and all the manufacturing, technical, engineering, and design jobs associated with them would move from Asia to the US too. The US lost a third of it’s manufacturing jobs to China during the last 20 years. A painful period, but the trend is reversing.
If high tech manufacturing in computer chips, solar panels, and automobiles is moved from China to the US, it will have major impact on education, jobs, and debt issues in the US. It will give a huge boost to the housing market, including new home construction.
Even with big housing construction numbers flooding the market, demand from Americans would grow to keep prices elevated. New York, Miami, Los Angeles, San Francisco and Florida will likely not see any ease in prices for home buying or apartment rentals.
|
Housing and Interest Rate – 2019
|
|||||||
| 2013 | 2014 | 2015 | 2016 | 2017 | 2018 | 2019 | |
| Housing Activity (000) | |||||||
| Total Housing Starts | 928 | 1,001 | 1,107 | 1,177 | 1,204 | 1,246 | 1,299 |
| Single Family | 620 | 647 | 712 | 784 | 842 | 900 | 962 |
| Multifamily | 308 | 355 | 395 | 393 | 362 | 346 | 337 |
| New Single Family Sales | 430 | 440 | 503 | 561 | 610 | 647 | 693 |
| Existing Single-Family Home Sales | 4,475 | 4,338 | 4,627 | 4,828 | 4,978 | 5,029 | 5,119 |
The US government’s push to protect US intellectual property could create a crippling blow to Asian countries who have had free, easy access in the past.
Check the major housing markets in Los Angeles, Florida, San Francisco, Miami, Houston, New York, Seattle and Boston.
IS 2019 THE BEST TIME TO SELL YOUR HOUSE?
The answer is likely affirmative for now till 2019 to sell. Let go of the past and move forward to a better life before home prices fall.
It’s looming opportunity or threat of the years ahead. Election Predictions 2020? A Trump loss in 2020, could be bring radical and devastating economic change in the US. There is no going back on Make America Great Again
Trump’s insistence on growing U.S. productivity, creating jobs, raise wages, and create a fair trade environment might be overturned by the democrats. The corporate stock markets have performed well and should continue their upward climb unless the next government sends it all back to Asia.
Small business is doing well too. The Russell 2000 index is performing well.
Even with Trump as President, there’s a small chance of a housing crash as the world weens itself away from US consumer spending. They’re planning their vengence right now. Europe is angry about getting blamed for China trade excesses and is enacting more trade barriers. But Europe and China were never buying US products so the threats are largely hollow and theoretic.
BUYING REAL ESTATE IN 2019
The best place to buy a home or condo in 2019 depends on your situation, finances and capabilities. Today, generalities don’t help. The US housing markets are incredibly diverse now and you must drill down into each local market.
Your next buy might be a multifamily unit in economically rising Austin Texas, or a condo in low availability New York, or maybe a fixer upper in Oakland, California. Caution is the keyword. A collapse in California, Seattle, or Las Vegas could bring homes down hundreds of thousands of dollars by 2021.
MAKE GOOD CHOICES IN WHERE AND WHAT TYPE OF HOME YOU BUY
While most real estate investors focus on selling and maximizing selling price and selling tactics, it’s where and what you buy that actually determines a good real estate investment. Researching the right properties, in the right cities/location, and understanding what will multiply the selling profit or rental income is where it’s at in 2019.
Are there any flips left? Yes, in Michigan, Illinois and Chicago. If high tech and auto industry comes back, and the Democrats win, they’ll have a tough time abandoning these states again. It will look really bad. Detroit, Chicago and Toledo might not be so bad after all.
Prices are high everywhere except Michigan. Can Trump succeed in building homes, and bringing back jobs and economic growth to these low priced states and cities? The people of Michigan, Nebraska, Minnesota, Iowa, Missouri, Indiapolis, Ohio, Arkansas, Kansas, Colorado, Wisconsin, Utah, and Dakotas are hoping so. These states have suffered severely with Free Trade.

The Democrats are trashing the President at every turn, threatening to return everything to the Obama trade deficit days. Jobs would return to China, and those massive trade deficits would be put back in place.
A crash is still a very real possibility. Real estate investors and stock market investors are scared stiff at the idea of the past returning, yet it could happen. Trump’s not a good marketer. He believes that if he just weathers the attacks, all is well. The voting public however, might believe the propaganda and the housing markets and stock markets could crash in 2 years, with a Trump exodus.
Yes, certain cities and states offer a more promising return in 2018, but this year is half over. 2019 will be here fast. Oil prices could fall, Kyoto accords and TTP deals could be resigned, US borders could open wide again for China, Mexico, Germany and Japan.
The anti Trump juggernaut, like a road rage lunatic on an LA expressway, could conceivably bring it all to a halt. This negative will affect all investor’s mindset in 2019 and the leadup to the 2020 elections.
The spectre of a housing crash should encourage caution. That’s why buying rental income property makes so much sense. And if you’re buying rental property, ensure you’re very smart about tenant selection. Should the market crash, you’ll have help paying that mortgage unless you choose vulnerable tenants. Evicting unemployed tenants may not be easy, and yet you’ll still have to make those mortgage payments.
HOUSING MARKET FACTORS 2019 TO 2024
- Millennials will have the funds finally to buy a house
- interest rates and mortgage rates will be slightly higher
- most markets will continue growth unless Trump loses
- inflation will be an issue
- increasingly the US will be exporting higher quality goods and services
When markets crash, typically government towns do well. Why not look for a government town that’s currently doing well enough? How will the housing markets in Los Angeles, San Diego, Boston, Chicago, Denver, Las Vegas, Dallas, Miami, Seattle, New York, Tampa, and Houston do in 2019.
Be careful with California, and Seattle. Europe is increasingly slapping and punching the FAANG companies around. Why would they give the big US monopolies a big chunk of their economy? They’ll kick them out. Pacific Trade? It’ll fade.
WHERE WILL NEW US COMPANIES SET UP SHOP?
Jobs are coming back, but where will they be? California and Texas are strong bets, but so are Michigan, Illinois and Ohio eventually. With Mexico and Canada out of the way, whoever has the cheapest land, buildings and labor will see big growth. Business startups are more digital and mobile now too, so there’s less reason to stay in New York or Silicon Valley. Phoenix, Las Vegas, Denver, Omaha, Austin, San Antonio, Dallas and other west coast cities might see strong economic and housing market growth in 2020.
Share this post on Facebook, Twitter, or Linkedin. It’s good to share!!