
Philadelphia Housing Market
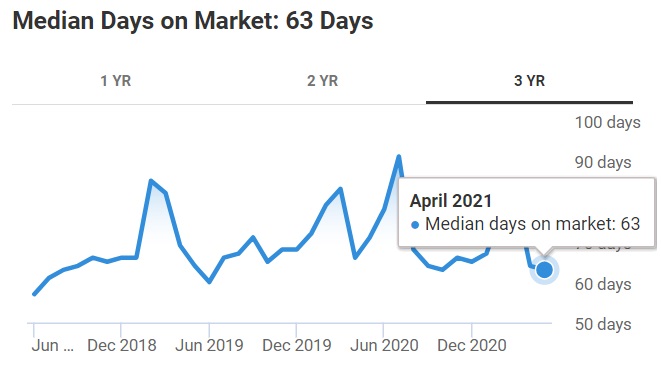
For real estate investors and homebuyers, the Philadelphia regional market has a lot to like. Kiplinger in fact, rated this city as one of the best places to retire. Homes are affordable compared other major cities. Prices are rising, however homes only on the market for 63 days according to NAR.
Just like most housing markets in the US, Philadelphia’s residential real estate market climbed during 2020 and is poised to surge much higher this year. A key determinant of future prices is the severe shortage of properties for sale.
NAR characterizes Philadelphia as a buyers market which could sound like a dinner bell to roving work from home buyer hopefuls. Philadelphia has 150 neighborhoods and there are 8,619 homes currently for sale, ranging from $5K to $25M. That’s lots of properties to bid on and perhaps a great opportunity to pick some fixer uppers. For rental investing, rents for 2,3, or 4 bedroom homes has risen 50% in the last 5 years.
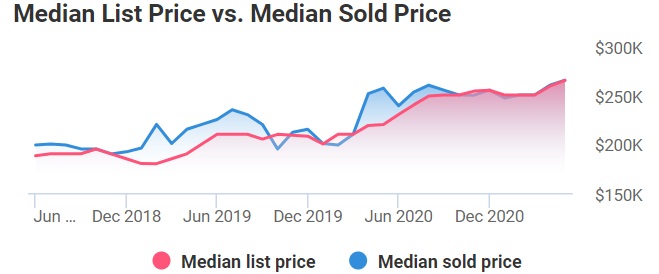
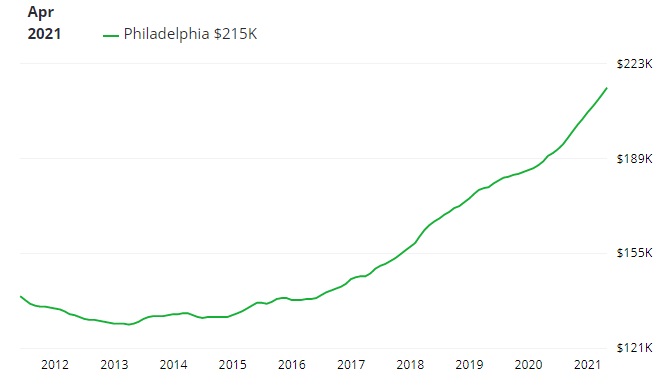
NAR reports that last month, April 2021, the median list price of homes in Philadelphia, PA reached $265K, rising 20.5% year-over-year. The median listing price per square foot was $202. The median list price is rising and given lower listing numbers, sold price is bound to rise in 2021 and 2022.
Philadelphia County Housing Market Report
Long and Foster offers a view of Philadelphia County sales and inventory. Inventory is falling very quickly. It may not be a buyer’s market for long.
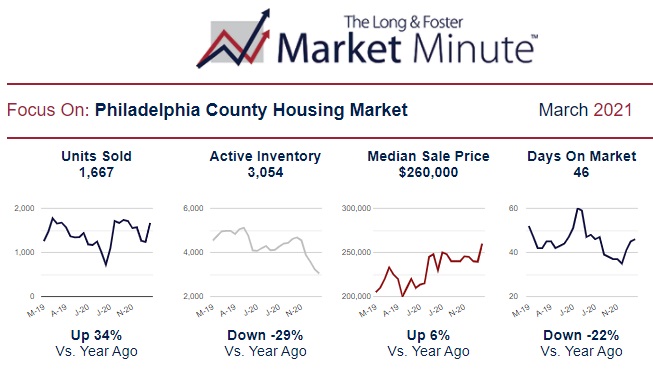
Philly is heating up, definitely not a buyers market and about as far from a crash as you can get. For investors, Philadelphia might be one of the best cities for capital appreciation by 2022. See also the Atlanta report.
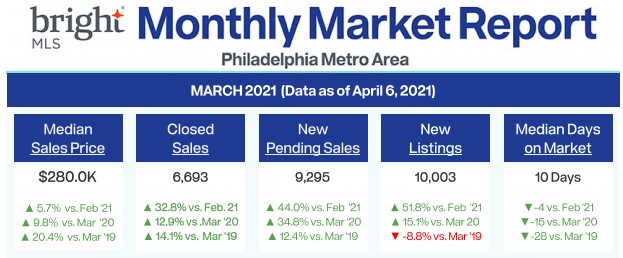
In Metro Philadelphia, home prices rose to 280,000 on average, very affordable compared to most of the US. Prices rose 5.7% vs February 2021, and home sales jumped 32.8%. Pending new sales are up by 44% and new listings are giving buyers a shot at owning a home, up 51.1%.
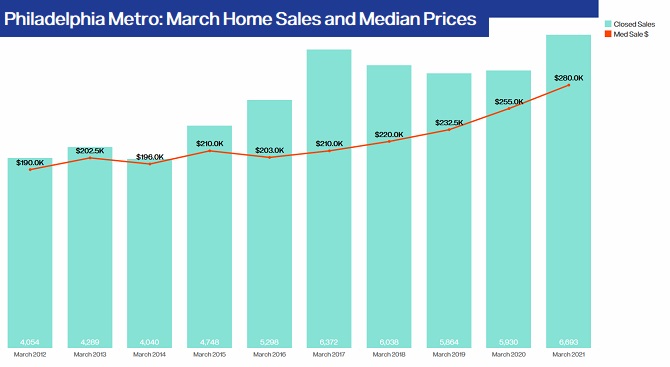
First quarter 2021 median sales prices hit $275,000 up $30k from Q1 2020. Q1 2021 sales rose 13% compared to last Q1 2020, and townhome sales prices hit a new 10 year high of $245,000 and sales hit 3714 for the quarter. Homes stayed on the market for only 12 days and that is down strongly from 34 days the same period in 2020. NAR publishes an average home price of $265,000.
See more on other real estate housing markets in the Bay Area, Los Angeles, Miami, Houston, Seattle, Chicago, Tampa, San Diego, Dallas, Denver and Boston. Explore the Florida housing market, California housing market and the New York Housing Market.
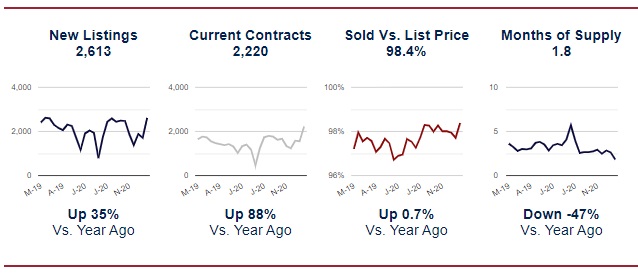
How does this city compare with the best cities to invest in and with cities most likely to crash? Prices are expected to rise 13.4%, listings have fallen 1200 during the last month, foreclosures are up, and sales actually rose 18% last month. Sold vs list price was 98% which is much stronger than average in the last 2 years.
| Philadelphia Community | Homes For Sale | Median Sale Price | Price Growth | Price Growth Forecast |
| Bustleton | 37 | $239,900 | 7.8% | 9% |
| Chestnut Hill | 35 | $737,500 | 7.80% | 9% |
| East Mount Airy | 55 | $200,000 | 1.10% | 1.60% |
| Fishtown | 122 | $324,947 | 8.40% | 10.70% |
| Fox Chase | 23 | $229,900 | 10.30% | 9.80% |
| Mayfair | 47 | $179,000 | 11.80% | 14.20% |
| Millbrook | 7 | $195,000 | 12.40% | |
| Overbrook | 67 | $153,900 | 5.20% | 13.80% |
| Oxford Circle | 68 | $156,750 | 9.40% | 14.90% |
| Point Breeze | 164 | $309,900 | 23.20% | 4.30% |
| Rhawnhurst | 34 | $229,900 | 11.40% | 14% |
| Rittenhouse Square | 103 | $554,450 | 1.60% | |
| Somerton | 35 | $243,400 | 6.10% | 8.70% |
| West Mount Airy | 44 | $349,900 | 1.10% | 1.60% |
| West Oak Lane | 79 | $140,000 | 0.60% | 12.20% |
What’s Driving Philadelphia’s Market
Although not enjoying the same employment rate growth of Dallas or Phoenix, job growth in Philadelphia-Camden-Wilmington, PA-NJ-DE-MD Metropolitan Statistical Area rose 39,700, or 1.4% over the year, according to the U.S. Bureau of Labor Statistics. Demand for homes is steady but availability is the issue as it is in so many cities across the country.
Word is, that the market is driven by Millennials and Babyboomers. It seems millennials are selling their big houses in favor of renting. As rental opportunities appear, we might see more sell their homes.
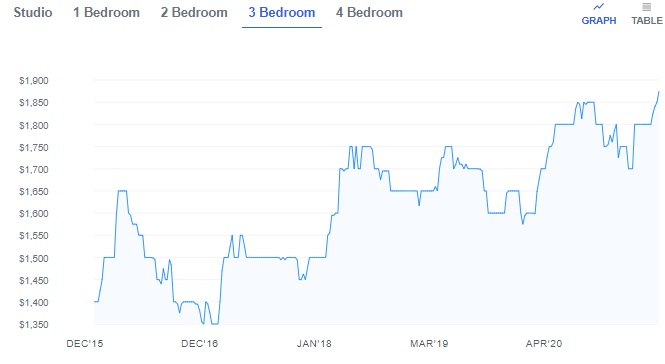
Philadelphia Home Rental
For investors, the Philly rental might be worth a look. 3 bedroom homes are up 6% in the last year on average according to Zumper.
Real Estate Housing Market | Home Equity Rising | Reverse Mortgages | Housing Market | 3 Month Stock Market Predictions | 5 Year Stock Forecast | Dow Jones Forecast 2024 | NASDAQ Forecast 2024 | S&P 500 Predictions 2024 | Stocks Next Week | 6 Month Outlook | Stock Prediction Software