
Unemployment Rate in the United States
The Covid 19 pandemic interrupted a very positive reduction in the unemployment rate in the United states. 8 years of strong growth during the bull market stock market was crippled by the shutdowns.
Now in late 2021, the economic recovery is beginning to deliver stronger job growth (4.8% unemployment rate) and much lower rates, yet the US jobs market forecast has some headwinds. A number of strange forces are slowing the job growth rate.
See the unemployment rates for each US state and top 250 cities below.
This Covid recession is something none have experienced in our lifetimes. Only those who survived the great Spanish Flu epidemic would understand. Unfortunately, it’s trendy today to ignore the wisdom of the past. And that’s what makes forecasts so valuable.
The data provided by Trading Economics provides us with excellent snapshots of the employment levels, however we still need to interpret why job growth is happening and whether it will continue. Job growth will reflect stock market growth and economic growth.
US Labor Participation Rate
This graphic suggests the participation rate is heading downward, which is disturbing. The unemployment doesn’t mean much when then this rate drops. When fewer people participate, it can put pressure on the economy and social safety nets.

Job Openings
Job openings in 2021 have rocketed as businesses reopened, yet workers have moved or don’t want to return to what they were doing before. For the unemployed, it’s created a bonanza of opportunity, if they have a place to live and can afford to live on the wages offered.
US Unemployment a Tough Issue The Government Can’t Handle
US unemployment is an extremely complicated issue so if the economists can’t explain it to you, it’s because they can’t comprehend it either. The trends vary from city to city and state to state, which reminds everyone of how complex the United States is as a nation. The promise of fascism had taken hold the last few years, but people are realizing this country is full of people and groups who have their own value and do not serve corporate objectives.
The coming battle between multinational corporations and Americans will be vicious. Reconsider your investment in Faang stocks.
The rise of inflation is a concern and has traditionally forewarned of market crashes. Will this be the exception? My Uncle always warned that when help wanted signs appeared on business store fronts, a crash is coming. Yet media experts say this time it’s different. They believe the Democrats can spend to oblivion and keep the ship afloat. With debt issues and inflation rocketing, some have doubts.
The Republicans look to see Democrat dependence on printed money as their big weakness and they’ll may block out of control, unjustified spending. If the Republicans regain control of the senate in 2022, spending will end. Unemployment will rise.
That means this weak fledgling, debt driven recovery might not have any legs. Americans haven’t come to grips with the realization of $700 billion dollar trade deficits and $30 Trillion dollar debts and debt ceiling limits. In early December, this issue comes back into the media and political arena full force. The fact is, the US is already in default and can’t go on.
In 2023, an economic force (rising interest rates, ended government stimulus) will push unemployment up. Millions of Americans will be devastated (the poor and unhoused) creating a new political movement of pro American employment. Never seen before pressures will hit the Democrats and Republicans. The media will lose all credibility and it is going to be rough period.
Hold on though, since we’ll get through it with new leadership and rules. The disaster will result in a new realization and commitment to American values. Obedience to unrealistic global, multinational profit goals and ideologies will collapse. It may be the end of globalism. The American economy will regrow and surge forward as US business supports itself and begins to pursue its agenda again.
A new common sense approach to energy will emerge with technology playing a role in using fossil fuels in an environmentally sensitive way. Clean coal and clean oil will rise as real solutions because they have to. The world needs a lot of energy. Alternative energy sources have failed. The experiment is over.
The best jobs in the US will respond to solve the global climate crisis and create profit from it. It’s all about turning bad to good. The green stocks people will invest in, are fossil fuel companies that have evolved.
Joblessless in September
Job growth was expected in September and it happened, but that’s hardly enough of the real story in work today. The jobless rate improved significantly from 5.2% down to 4.8%. Yet few economists were jumping for joy. There’s a deeper issue here.
US Jobless Rate Falls More than Forecast
The US unemployment rate dropped to 4.8 percent in September 2021, from 5.2 percent in the previous month and below market expectations of 5.1 percent. It was the lowest rate since March 2020, as many people left the labor force and the negative effects of Hurricane Ida and the Delta variant’s summer spike started to fade. Still, the jobless rate remained well above the pre-crisis level of about 3.5 percent due to ongoing labor shortages but is seen declining further in the coming months as companies fill widespread vacancies and as more workers are expected to go back into the labor force — Statista
The unemployment rate is expected to fall as the United States reopens its shut down economy, which in hindsight was extremely destructive to employment. Corporations adopted technology including AI technology to reduce costs and widen service. For the unemployed and poverty stricken, how multinationals view growth is important. In a recession, companies cut labor costs and forget about growth.
With vaccinations and Merck pills administered, the death rate from Covid will fall and we’ll see workers heading back to situations that they’ve feared for almost 2 years.
The economic reopening does have power yet small businesses are unsupported and vulnerable. The astonishing intelligence and resilience of small business owners is actually the biggest positive in this China Wuhan virus crisis. US small business owners insist on living and thriving. Incredible persistence despite perennial low support from government.
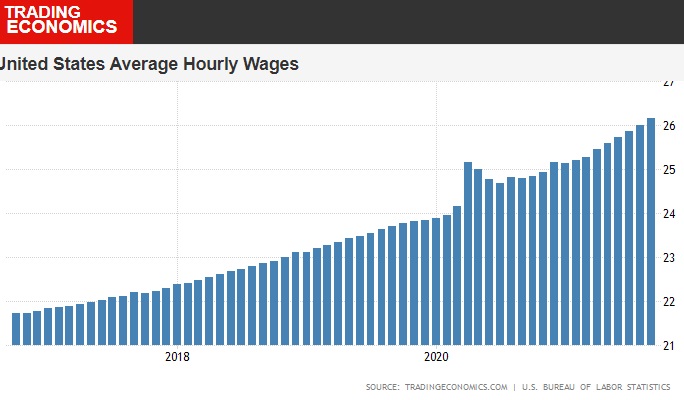
US Worker Wages in 2021
US wages for workers have seen strong growth due to the Covid threats and unavailability. Now as more workers enter the workforce we might see this moderate. The growth however is a positive for those looking for new positions.
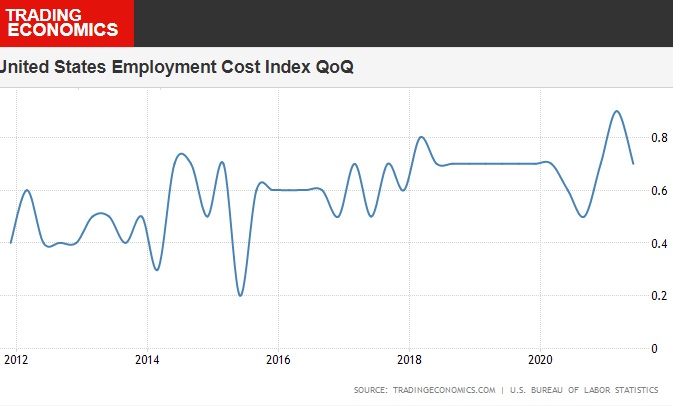
Cost of US Employees
In this graph, we see labor costs haven’t risen much which is a big positive for multinationals and small businesses. This means US workers are a bargain. Compare this to inflation and capital investment costs, and you see how American workers are a big key to future profits.
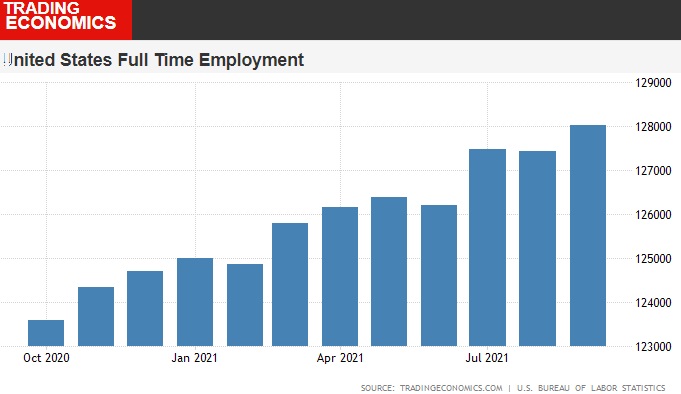
Full Time Employment in the Gig Economy
As long as multinationals rule, the gig economy determines employment. This chart from Statista show something very positive. It’s a growth in full time employment.
State Unemployment Rate Changes
State unemployment rate changes from July to August. (Source: U.S. Dept. of Labor, Bureau of Labor Statistics (BLS)
| State | July | August | Change |
| Alabama | 7.1 | 3.1 | 4 |
| Alaska | 7.2 | 6.4 | -0.8 |
| Arizona | 7 | 6.2 | -0.8 |
| Arkansas | 6.5 | 4.2 | -2.3 |
| California | 12.3 | 7.5 | -4.8 |
| Colorado | 7.1 | 5.9 | -1.2 |
| Connecticut | 8.4 | 7.2 | -1.2 |
| Delaware | 7.9 | 5.4 | -2.5 |
| District of Columbia | 8.8 | 6.5 | -2 |
| Florida | 7.9 | 5 | -2.9 |
| Georgia | 7 | 3.5 | -3.5 |
| Hawaii | 14.1 | 7 | -7.1 |
| Idaho | 4.9 | 2.9 | -2 |
| Illinois | 11.1 | 7 | -4.1 |
| Indiana | 7.3 | 4.1 | -3.2 |
| Iowa | 5.3 | 4.1 | -1.2 |
| Kansas | 6.2 | 3.8 | -2.4 |
| Kentucky | 5.5 | 4.3 | -1.2 |
| Louisiana | 8.2 | 6.2 | -2 |
| Maryland | 8.6 | 5.9 | -2.7 |
| Massachusetts | 9.3 | 5 | -4 |
| Michigan | 8.5 | 4.7 | -3.8 |
| Minnesota | 6.6 | 3.8 | -2.8 |
| Mississippi | 7.8 | 6 | -1.8 |
| Missouri | 6 | 4 | -2 |
| Montana | 5.8 | 3.5 | -2.3 |
| Nebraska | 4 | 2.2 | -1.8 |
| Nevada | 14.5 | 7.7 | -6.8 |
| New Hampshire | 6.6 | 3 | -3.6 |
| New Jersey | 11 | 7.2 | -3.8 |
| New Mexico | 9.3 | 7.2 | -2.1 |
| New York | 11.7 | 7.4 | -4.3 |
| North Carolina | 6.8 | 4.3 | -2.5 |
| North Dakota | 6.1 | 3.6 | -2.5 |
| Ohio | 9 | 5.4 | 3.6 |
| Oklahoma | 6.3 | 3.2 | -3.1 |
| Oregon | 8.4 | 4.9 | -3.5 |
| Pennsylvania | 10.2 | 6.4 | -3.8 |
| Rhode Island | 12.6 | 5.8 | -6.8 |
| South Carolina | 5.4 | 4.2 | -1.2 |
| South Dakota | 4.7 | 2.9 | -1.8 |
| Tennessee | 8.1 | 4.6 | -3.5 |
| Texas | 6.9 | 5.9 | -1 |
| Utah | 4.8 | 2.6 | -2.2 |
| Vermont | 5.4 | 3 | -2.4 |
| Virginia | 7 | 4 | -3 |
| Washington | 9.1 | 5.1 | -4 |
| West Virginia | 8.5 | 4.8 | -3.7 |
| Wisconsin | 6.1 | 3.9 | -2.2 |
| Wyoming | 6.2 | 4.9 | -1.3 |
Unemployment Rates for 250 US Cities
Source: U.S. Dept. of Labor, Bureau of Labor Statistics (BLS)
| Metropolitan area | August 2021 Rate | US City Rank |
| United States | 5.3 | |
| Lincoln, NE | 1.7 | 1 |
| Grand Island, NE | 1.9 | 2 |
| Logan, UT-ID | 2 | 3 |
| Idaho Falls, ID | 2.1 | 4 |
| Gainesville, GA | 2.2 | 5 |
| Omaha-Council Bluffs, NE-IA | 2.3 | 6 |
| Provo-Orem, UT | 2.3 | 6 |
| Columbia, MO | 2.4 | 8 |
| Sioux Falls, SD | 2.4 | 8 |
| Enid, OK | 2.5 | 10 |
| Fargo, ND-MN | 2.5 | 10 |
| Jefferson City, MO | 2.5 | 10 |
| Ogden-Clearfield, UT | 2.5 | 10 |
| Decatur, AL | 2.6 | 14 |
| Huntsville, AL | 2.6 | 14 |
| Oklahoma City, OK | 2.6 | 14 |
| Pocatello, ID | 2.6 | 14 |
| Portsmouth, NH-ME Metropolitan NECTA | 2.6 | 14 |
| Salt Lake City, UT | 2.6 | 14 |
| Boise City, ID | 2.7 | 20 |
| Burlington-South Burlington, VT Metropolitan NECTA | 2.7 | 20 |
| Dover-Durham, NH-ME Metropolitan NECTA | 2.7 | 20 |
| Fayetteville-Springdale-Rogers, AR-MO | 2.7 | 20 |
| Lewiston, ID-WA | 2.7 | 20 |
| Springfield, MO | 2.7 | 20 |
| St. George, UT | 2.7 | 20 |
| Twin Falls, ID | 2.7 | 20 |
| Athens-Clarke County, GA | 2.8 | 28 |
| Billings, MT | 2.8 | 28 |
| Bismarck, ND | 2.8 | 28 |
| Daphne-Fairhope-Foley, AL | 2.8 | 28 |
| Elkhart-Goshen, IN | 2.8 | 28 |
| Manchester, NH Metropolitan NECTA | 2.8 | 28 |
| Missoula, MT | 2.8 | 28 |
| Rochester, MN | 2.8 | 28 |
| Winchester, VA-WV | 2.8 | 28 |
| Auburn-Opelika, AL | 2.9 | 37 |
| Coeur d’Alene, ID | 2.9 | 37 |
| Columbus, IN | 2.9 | 37 |
| Rapid City, SD | 2.9 | 37 |
| Rome, GA | 2.9 | 37 |
| Tulsa, OK | 2.9 | 37 |
| Warner Robins, GA | 2.9 | 37 |
| Ames, IA | 3 | 44 |
| Great Falls, MT | 3 | 44 |
| Hinesville, GA | 3 | 44 |
| Joplin, MO | 3 | 44 |
| Lawton, OK | 3 | 44 |
| Mankato-North Mankato, MN | 3 | 44 |
| St. Joseph, MO-KS | 3 | 44 |
| Atlanta-Sandy Springs-Roswell, GA | 3.1 | 51 |
| Birmingham-Hoover, AL | 3.1 | 51 |
| Dalton, GA | 3.1 | 51 |
| Grand Forks, ND-MN | 3.1 | 51 |
| La Crosse-Onalaska, WI-MN | 3.1 | 51 |
| Madison, WI | 3.1 | 51 |
| Savannah, GA | 3.1 | 51 |
| Valdosta, GA | 3.1 | 51 |
| Brunswick, GA | 3.2 | 59 |
| Cape Girardeau, MO-IL | 3.2 | 59 |
| Jonesboro, AR | 3.2 | 59 |
| Lexington-Fayette, KY | 3.2 | 59 |
| Sheboygan, WI | 3.2 | 59 |
| Staunton-Waynesboro, VA | 3.2 | 59 |
| Appleton, WI | 3.3 | 65 |
| Blacksburg-Christiansburg-Radford, VA | 3.3 | 65 |
| Cheyenne, WY | 3.3 | 65 |
| Dothan, AL | 3.3 | 65 |
| Harrisonburg, VA | 3.3 | 65 |
| Wausau, WI | 3.3 | 65 |
| Charlottesville, VA | 3.4 | 71 |
| Fort Smith, AR-OK | 3.4 | 71 |
| Louisville/Jefferson County, KY-IN | 3.4 | 71 |
| Macon-Bibb County, GA | 3.4 | 71 |
| Sioux City, IA-NE-SD | 3.4 | 71 |
| Augusta-Richmond County, GA-SC | 3.5 | 76 |
| Bowling Green, KY | 3.5 | 76 |
| Eau Claire, WI | 3.5 | 76 |
| Florence-Muscle Shoals, AL | 3.5 | 76 |
| Fond du Lac, WI | 3.5 | 76 |
| Knoxville, TN | 3.5 | 76 |
| Minneapolis-St. Paul-Bloomington, MN-WI | 3.5 | 76 |
| Nashville-Davidson–Murfreesboro–Franklin, TN | 3.5 | 76 |
| Amarillo, TX | 3.6 | 84 |
| Bloomington, IN | 3.6 | 84 |
| Green Bay, WI | 3.6 | 84 |
| Hilton Head Island-Bluffton-Beaufort, SC | 3.6 | 84 |
| Iowa City, IA | 3.6 | 84 |
| Lafayette-West Lafayette, IN | 3.6 | 84 |
| Oshkosh-Neenah, WI | 3.6 | 84 |
| Owensboro, KY | 3.6 | 84 |
| Roanoke, VA | 3.6 | 84 |
| Chattanooga, TN-GA | 3.7 | 93 |
| Des Moines-West Des Moines, IA | 3.7 | 93 |
| Detroit-Warren-Dearborn, MI | 3.7 | 93 |
| Durham-Chapel Hill, NC | 3.7 | 93 |
| Greenville-Anderson-Mauldin, SC | 3.7 | 93 |
| Indianapolis-Carmel-Anderson, IN | 3.7 | 93 |
| Morgantown, WV | 3.7 | 93 |
| Raleigh, NC | 3.7 | 93 |
| St. Cloud, MN | 3.7 | 93 |
| Tuscaloosa, AL | 3.7 | 93 |
| Alexandria, LA | 3.8 | 103 |
| Ann Arbor, MI | 3.8 | 103 |
| Asheville, NC | 3.8 | 103 |
| Austin-Round Rock, TX | 3.8 | 103 |
| Charleston-North Charleston, SC | 3.8 | 103 |
| Columbus, GA-AL | 3.8 | 103 |
| Corvallis, OR | 3.8 | 103 |
| Crestview-Fort Walton Beach-Destin, FL | 3.8 | 103 |
| Duluth, MN-WI | 3.8 | 103 |
| Elizabethtown-Fort Knox, KY | 3.8 | 103 |
| Evansville, IN-KY | 3.8 | 103 |
| Kansas City, MO-KS | 3.8 | 103 |
| Manhattan, KS | 3.8 | 103 |
| Topeka, KS | 3.8 | 103 |
| Dubuque, IA | 3.9 | 117 |
| Fairbanks, AK | 3.9 | 117 |
| Grand Rapids-Wyoming, MI | 3.9 | 117 |
| Midland, MI | 3.9 | 117 |
| Portland-South Portland, ME Metropolitan NECTA | 3.9 | 117 |
| Walla Walla, WA | 3.9 | 117 |
| Wilmington, NC | 3.9 | 117 |
| Columbia, SC | 4 | 124 |
| Gadsden, AL | 4 | 124 |
| Kingsport-Bristol-Bristol, TN-VA | 4 | 124 |
| Lawrence, KS | 4 | 124 |
| Little Rock-North Little Rock-Conway, AR | 4 | 124 |
| Lynchburg, VA | 4 | 124 |
| Waterloo-Cedar Falls, IA | 4 | 124 |
| Anniston-Oxford-Jacksonville, AL | 4.1 | 131 |
| Cleveland, TN | 4.1 | 131 |
| Hickory-Lenoir-Morganton, NC | 4.1 | 131 |
| Johnson City, TN | 4.1 | 131 |
| Panama City, FL | 4.1 | 131 |
| Richmond, VA | 4.1 | 131 |
| Abilene, TX | 4.2 | 137 |
| Albany, GA | 4.2 | 137 |
| College Station-Bryan, TX | 4.2 | 137 |
| Gainesville, FL | 4.2 | 137 |
| Montgomery, AL | 4.2 | 137 |
| Morristown, TN | 4.2 | 137 |
| Naples-Immokalee-Marco Island, FL | 4.2 | 137 |
| New Bern, NC | 4.2 | 137 |
| Reno, NV | 4.2 | 137 |
| Sherman-Denison, TX | 4.2 | 137 |
| St. Louis, MO-IL(1) | 4.2 | 137 |
| Charlotte-Concord-Gastonia, NC-SC | 4.3 | 148 |
| Hagerstown-Martinsburg, MD-WV | 4.3 | 148 |
| Jacksonville, FL | 4.3 | 148 |
| Lubbock, TX | 4.3 | 148 |
| Palm Bay-Melbourne-Titusville, FL | 4.3 | 148 |
| Prescott, AZ | 4.3 | 148 |
| South Bend-Mishawaka, IN-MI | 4.3 | 148 |
| Spartanburg, SC | 4.3 | 148 |
| Wenatchee, WA | 4.3 | 148 |
| Winston-Salem, NC | 4.3 | 148 |
| Bend-Redmond, OR | 4.4 | 158 |
| Boulder, CO | 4.4 | 158 |
| Bremerton-Silverdale, WA | 4.4 | 158 |
| Cincinnati, OH-KY-IN | 4.4 | 158 |
| Ithaca, NY | 4.4 | 158 |
| Jackson, TN | 4.4 | 158 |
| North Port-Sarasota-Bradenton, FL | 4.4 | 158 |
| Portland-Vancouver-Hillsboro, OR-WA | 4.4 | 158 |
| Salem, OR | 4.4 | 158 |
| Virginia Beach-Norfolk-Newport News, VA-NC | 4.4 | 158 |
| Bangor, ME Metropolitan NECTA | 4.5 | 168 |
| Beckley, WV | 4.5 | 168 |
| Burlington, NC | 4.5 | 168 |
| Cedar Rapids, IA | 4.5 | 168 |
| Charleston, WV | 4.5 | 168 |
| Florence, SC | 4.5 | 168 |
| Hot Springs, AR | 4.5 | 168 |
| Huntington-Ashland, WV-KY-OH | 4.5 | 168 |
| Janesville-Beloit, WI | 4.5 | 168 |
| Olympia-Tumwater, WA | 4.5 | 168 |
| Pensacola-Ferry Pass-Brent, FL | 4.5 | 168 |
| San Angelo, TX | 4.5 | 168 |
| Tampa-St. Petersburg-Clearwater, FL | 4.5 | 168 |
| Cape Coral-Fort Myers, FL | 4.6 | 181 |
| Carson City, NV | 4.6 | 181 |
| Clarksville, TN-KY | 4.6 | 181 |
| Glens Falls, NY | 4.6 | 181 |
| Houma-Thibodaux, LA | 4.6 | 181 |
| Kalamazoo-Portage, MI | 4.6 | 181 |
| Parkersburg-Vienna, WV | 4.6 | 181 |
| Spokane-Spokane Valley, WA | 4.6 | 181 |
| Terre Haute, IN | 4.6 | 181 |
| Waco, TX | 4.6 | 181 |
| Albany-Schenectady-Troy, NY | 4.7 | 191 |
| Columbus, OH | 4.7 | 191 |
| Dallas-Fort Worth-Arlington, TX | 4.7 | 191 |
| Fort Collins, CO | 4.7 | 191 |
| Goldsboro, NC | 4.7 | 191 |
| Greenville, NC | 4.7 | 191 |
| Jacksonville, NC | 4.7 | 191 |
| Tallahassee, FL | 4.7 | 191 |
| Tyler, TX | 4.7 | 191 |
| Wichita Falls, TX | 4.7 | 191 |
| California-Lexington Park, MD | 4.8 | 201 |
| Gettysburg, PA | 4.8 | 201 |
| Medford, OR | 4.8 | 201 |
| Mobile, AL | 4.8 | 201 |
| Muncie, IN | 4.8 | 201 |
| Niles-Benton Harbor, MI | 4.8 | 201 |
| Phoenix-Mesa-Scottsdale, AZ | 4.8 | 201 |
| San Antonio-New Braunfels, TX | 4.8 | 201 |
| San Jose-Sunnyvale-Santa Clara, CA | 4.8 | 201 |
| Anchorage, AK | 4.9 | 210 |
| Deltona-Daytona Beach-Ormond Beach, FL | 4.9 | 210 |
| Fort Wayne, IN | 4.9 | 210 |
| Kennewick-Richland, WA | 4.9 | 210 |
| Lafayette, LA | 4.9 | 210 |
| Milwaukee-Waukesha-West Allis, WI | 4.9 | 210 |
| Monroe, LA | 4.9 | 210 |
| Port St. Lucie, FL | 4.9 | 210 |
| Sumter, SC | 4.9 | 210 |
| Washington-Arlington-Alexandria, DC-VA-MD-WV | 4.9 | 210 |
| Albany, OR | 5 | 220 |
| Baton Rouge, LA | 5 | 220 |
| Boston-Cambridge-Nashua, MA-NH Metropolitan NECTA | 5 | 220 |
| Casper, WY | 5 | 220 |
| Eugene, OR | 5 | 220 |
| Orlando-Kissimmee-Sanford, FL | 5 | 220 |
| Punta Gorda, FL | 5 | 220 |
| Salisbury, MD-DE | 5 | 220 |
| Seattle-Tacoma-Bellevue, WA | 5 | 220 |
| Bay City, MI | 5.1 | 229 |
| Danbury, CT Metropolitan NECTA | 5.1 | 229 |
| Davenport-Moline-Rock Island, IA-IL | 5.1 | 229 |
| Greensboro-High Point, NC | 5.1 | 229 |
| Jackson, MI | 5.1 | 229 |
| Kingston, NY | 5.1 | 229 |
| Lewiston-Auburn, ME Metropolitan NECTA | 5.1 | 229 |
| Racine, WI | 5.1 | 229 |
| Texarkana, TX-AR | 5.1 | 229 |
| Barnstable Town, MA Metropolitan NECTA | 5.2 | 238 |
| Bellingham, WA | 5.2 | 238 |
| Bloomington, IL | 5.2 | 238 |
| Canton-Massillon, OH | 5.2 | 238 |
| Monroe, MI | 5.2 | 238 |
| Mount Vernon-Anacortes, WA | 5.2 | 238 |
| Myrtle Beach-Conway-North Myrtle Beach, SC-NC | 5.2 | 238 |
| Rochester, NY | 5.2 | 238 |
| Sierra Vista-Douglas, AZ | 5.2 | 238 |
| Watertown-Fort Drum, NY | 5.2 | 238 |
| Wichita, KS | 5.2 | 238 |
| Akron, OH | 5.3 | 249 |
| Baltimore-Columbia-Towson, MD | 5.3 | 249 |
| Cleveland-Elyria, OH | 5.3 | 249 |
| Dayton, OH | 5.3 | 249 |
Baby Boomers Not Necessarily Retiring
It’s believed everyone retires at 65 but it’s just not true. That was more a corporate objective to get rid of those with high wages (they’ll keep doing that). With Artificial Intelligence technology coming in, there may be a chance to keep seniors employed. The system can accommodate them.
Unemployment by Occupation USA
|
Occupation
|
Total unemployed | Unemployment rates | ||
|
Sept.
2020 |
Sept.
2021 |
Total | ||
| Sept. 2020 |
Sept. 2021 |
|||
| Total, 16 years and over(1) | 12,277 | 7,366 | 7.7 | 4.6 |
| Management, professional, and related | 2,946 | 1,580 | 4.5 | 2.4 |
| Management, business, and financial operations | 1,336 | 669 | 4.8 | 2.3 |
| Management | 831 | 377 | 4.3 | 1.9 |
| Business and financial operations | 504 | 292 | 5.8 | 3.2 |
| Professional and related | 1,611 | 911 | 4.3 | 2.4 |
| Computer and mathematical | 189 | 123 | 3.5 | 2.2 |
| Architecture and engineering | 108 | 96 | 3.4 | 2.9 |
| Life, physical, and social science | 63 | 37 | 3.9 | 2 |
| Community and social service | 78 | 67 | 2.8 | 2.3 |
| Legal | 39 | 33 | 2 | 1.7 |
| Education, training, and library | 551 | 260 | 5.8 | 2.8 |
| Arts, design, entertainment, sports, and media | 313 | 133 | 9.4 | 4.2 |
| Healthcare practitioners and technical | 270 | 162 | 2.7 | 1.6 |
| Service | 3,200 | 1,758 | 12 | 6.4 |
| Healthcare support | 385 | 280 | 7.2 | 5.3 |
| Protective service | 137 | 139 | 4.2 | 4.6 |
| Food preparation and serving related | 1,473 | 675 | 17.7 | 7.8 |
| Building and grounds cleaning and maintenance | 576 | 361 | 10 | 5.7 |
| Personal care and service | 629 | 303 | 15.8 | 7.2 |
| Sales and office | 2,610 | 1,525 | 8.1 | 4.9 |
| Sales and related | 1,388 | 782 | 8.9 | 5.2 |
| Office and administrative support | 1,222 | 743 | 7.3 | 4.6 |
| Natural resources, construction, and maintenance | 1,023 | 700 | 7 | 4.7 |
| Farming, fishing, and forestry | 61 | 71 | 5.9 | 6.5 |
| Construction and extraction | 702 | 427 | 8 | 4.9 |
| Installation, maintenance, and repair | 261 | 202 | 5.3 | 3.9 |
| Production, transportation, and material moving | 1,953 | 1,298 | 9.7 | 6.3 |
| Production | 691 | 463 | 8.2 | 5.5 |
| Transportation and material moving | 1,262 | 835 | 10.7 | 6.9 |
This too will affect the US unemployment rate which measures those looking for work. With so many seniors unemployed and without retirement funds, they will remain in the active workforce. Although many are of poor health, others are very healthy and capable of working into their 80s.
This is not the employment environment of 40 years ago. The whole realm of employability is changing along with international trade and economic changes. The US government knows China and India have billions of young workers, and will begin to focus instead on employing our youth instead.
This is not what the big tech companies and multinationals want, but it has to be. If Americans have no money to spend, the US will become a forgotten entity. That’s not good for the US unemployment rate.
See more on the stock market forecast next 3 months.
Stock Market Today | Stock Market Crash | 3 Month Stock Market Predictions | 5 Year Stock Forecast | Dow Jones Forecast | NASDAQ Forecast | Oil Price | S&P Predictions | Stocks Next Week | 6 Month Outlook | Stock Prediction Software